Generic Drug Pricing in Canada: Closing the Gap
PDF - 685 KB
Canada has one of the strongest generic markets in the industrialized world, yet the prices of generic medicines have traditionally been much higher than international levels. In April 2018, a five-year joint initiative between the pan-Canadian Pharmaceutical Alliance (pCPA) and the Canadian Generic Pharmaceutical Association came in effect, aimed at reducing the prices of up to 70 of the most commonly prescribed generics to as low as 10% of their brand-name equivalents. These drugs include those used to treat high blood pressure, high cholesterol, and depression, and are collectively used by millions of Canadians.Footnote 1
This analysis examines the market segments targeted by the recent policy change, measuring its success in closing the gap between Canadian and international prices. It also highlights the latest trends in Canadian sales, utilization, and pricing of generic medicines within an international context. The primary data source is the IQVIA MIDAS™ Database for the fourth quarter of 2018 (Q4-2018).
International price comparisons are based on 584 leading oral solid prescription medicines, making up 76% of all generic sales in Canada (almost $1 billion) in Q4-2018. The international markets examined include the Organisation for Economic Co-operation and Development (OECD) members, with a focus on the seven countries the PMPRB considers in reviewing the prices of patented medicines (PMPRB7): France, Germany, Italy, Sweden, Switzerland, the United Kingdom (UK), and the United States (US).
These findings will be published in the next edition of the PMPRB’s Generics360 report, which provides information on generic pricing, sales, and utilization to inform discussions and support evidence-based decision making for policy makers, the pharmaceutical industry, and patients.
1. Canada has one of the strongest generic drug markets in the OECD
Sales of generic medicines in Canada have almost doubled over the last decade, accounting for more than $5.4 billion in 2018. Per capita, Canadians spent more on generic medicines than residents of any other OECD country, except the US. This is in part due to relatively high generic use. Canada ranks third in the OECD in terms of the share of units sold, with generics making up 76% of the Canadian retail pharmaceutical market in 2018.
Per capita generic spending and market share, OECD, 2018
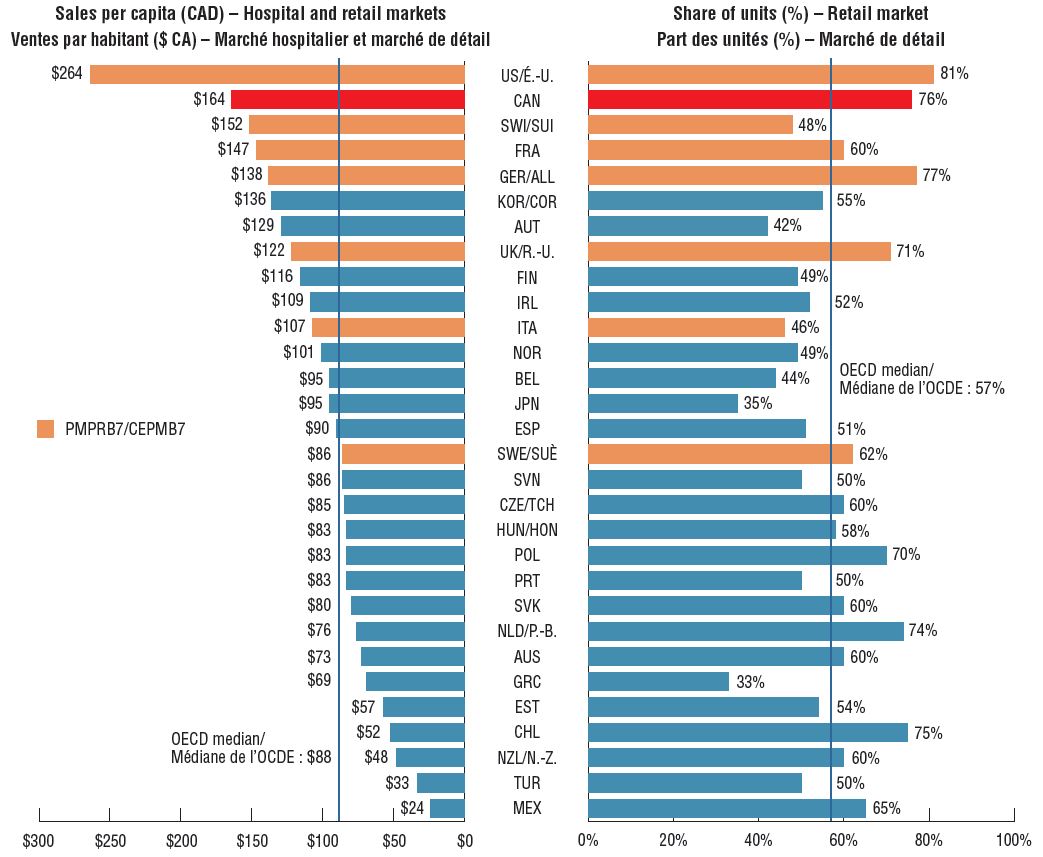
Figure description
This is a split bar graph giving the per capita spending and market share of generics medicines in each country in the Organisation for Economic Co-operation and Development. The left side of the graph gives the per capita generic sales for the retail and hospital pharmaceutical markets in Canadian dollars. The right side gives the share of units sold for the retail market.
| Country |
Per capita spending in Canadian dollars |
Share of units for retail market |
| United States |
$264 |
81% |
| Canada |
$164 |
76% |
| Switzerland |
$152 |
48% |
| France |
$147 |
60% |
| Germany |
$138 |
77% |
| South Korea |
$136 |
55% |
| Austria |
$129 |
42% |
| United Kingdom |
$122 |
71% |
| Finland |
$116 |
49% |
| Ireland |
$109 |
52% |
| Italy |
$107 |
46% |
| Norway |
$101 |
49% |
| Belgium |
$95 |
44% |
| Japan |
$95 |
35% |
| Spain |
$90 |
51% |
| OECD median |
$88 |
57% |
| Sweden |
$86 |
62% |
| Slovenia |
$86 |
50% |
| Czech Republic |
$85 |
60% |
| Hungry |
$83 |
58% |
| Poland |
$83 |
70% |
| Portugal |
$83 |
50% |
| Slovakia |
$80 |
60% |
| Netherlands |
$76 |
74% |
| Australia |
$73 |
60% |
| Greece |
$69 |
33% |
| Estonia |
$57 |
54% |
| Chile |
$52 |
75% |
| New Zealand |
$48 |
60% |
| Turkey |
$33 |
50% |
| Mexico |
$24 |
65% |
2. Generic prices in Canada have fallen more than prices in comparable countries following the implementation of provincial and pCPA pricing policies
As a result of recent policies, generic retail sales in Canada declined by 7% in 2018, with the price index clearly showing the marked reduction.
Since 2007, the average price of generics in Canada has decreased by almost 60%, with some of the highest-selling medicines dropping by 80% on average. As a result, despite the continued uptake in generic use, which increased from 62% to 76% of the pharmaceutical retail market between 2010 and 2018, the share of generic sales has declined from 32% to 25% over the same period.
Price index for generic medicines, Canada versus the OECD average, and corresponding price reductions in the PMPRB7, Q4-2007 to Q4-2018
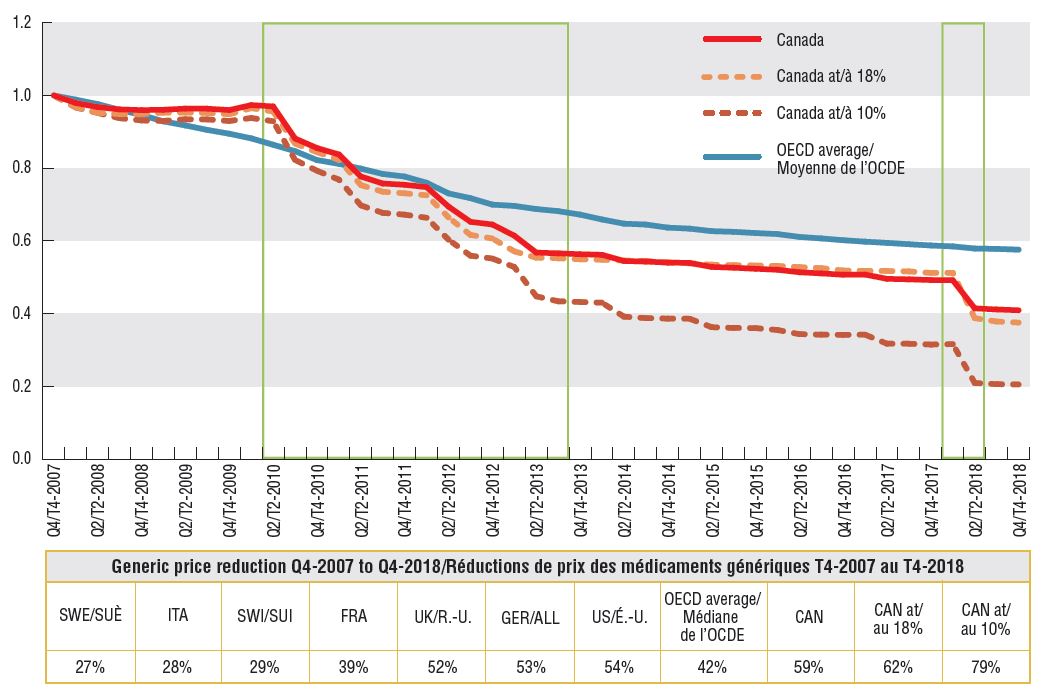
Figure description
This line graph and accompanying table focus on the price reductions for generic medicines from Q4-2007 to Q4-2018. The line graph gives the price indices for all generic medicines in Canada, as well as those at 18% and 10% of their brand-name prices, and compares these with the OECD average over the same time period. The accompanying table gives the associated generic price reduction for the Canadian markets and OECD average, as well as for each of the PMPRB7 countries.
Price indices:
|
Canada: all generics |
Canada: generics at 18% |
Canada: generics at 10% |
OECD average |
| Q4-2007 |
1.00 |
1.00 |
1.00 |
1.00 |
| Q1-2008 |
0.98 |
0.97 |
0.97 |
0.99 |
| Q2-2008 |
0.97 |
0.95 |
0.95 |
0.98 |
| Q3-2008 |
0.96 |
0.95 |
0.94 |
0.96 |
| Q4-2008 |
0.96 |
0.95 |
0.93 |
0.95 |
| Q1-2009 |
0.96 |
0.95 |
0.93 |
0.93 |
| Q2-2009 |
0.96 |
0.95 |
0.93 |
0.92 |
| Q3-2009 |
0.96 |
0.95 |
0.93 |
0.91 |
| Q4-2009 |
0.96 |
0.95 |
0.93 |
0.89 |
| Q1-2010 |
0.97 |
0.97 |
0.94 |
0.88 |
| Q2-2010 |
0.97 |
0.96 |
0.93 |
0.86 |
| Q3-2010 |
0.88 |
0.87 |
0.82 |
0.85 |
| Q4-2010 |
0.86 |
0.84 |
0.79 |
0.82 |
| Q1-2011 |
0.84 |
0.82 |
0.77 |
0.81 |
| Q2-2011 |
0.78 |
0.75 |
0.70 |
0.80 |
| Q3-2011 |
0.76 |
0.74 |
0.68 |
0.78 |
| Q4-2011 |
0.75 |
0.73 |
0.67 |
0.78 |
| Q1-2012 |
0.75 |
0.73 |
0.66 |
0.76 |
| Q2-2012 |
0.69 |
0.66 |
0.60 |
0.73 |
| Q3-2012 |
0.65 |
0.62 |
0.56 |
0.72 |
| Q4-2012 |
0.65 |
0.61 |
0.55 |
0.70 |
| Q1-2013 |
0.61 |
0.57 |
0.53 |
0.70 |
| Q2-2013 |
0.57 |
0.55 |
0.45 |
0.69 |
| Q3-2013 |
0.57 |
0.55 |
0.43 |
0.68 |
| Q4-2013 |
0.56 |
0.55 |
0.43 |
0.67 |
| Q1-2014 |
0.56 |
0.55 |
0.43 |
0.66 |
| Q2-2014 |
0.54 |
0.55 |
0.39 |
0.65 |
| Q3-2014 |
0.54 |
0.55 |
0.39 |
0.65 |
| Q4-2014 |
0.54 |
0.54 |
0.39 |
0.64 |
| Q1-2015 |
0.54 |
0.54 |
0.39 |
0.63 |
| Q2-2015 |
0.53 |
0.53 |
0.36 |
0.63 |
| Q3-2015 |
0.53 |
0.53 |
0.36 |
0.63 |
| Q4-2015 |
0.52 |
0.53 |
0.36 |
0.62 |
| Q1-2016 |
0.52 |
0.53 |
0.36 |
0.62 |
| Q2-2016 |
0.51 |
0.53 |
0.34 |
0.61 |
| Q3-2016 |
0.51 |
0.53 |
0.34 |
0.61 |
| Q4-2016 |
0.51 |
0.52 |
0.34 |
0.60 |
| Q1-2017 |
0.51 |
0.52 |
0.34 |
0.60 |
| Q2-2017 |
0.50 |
0.52 |
0.32 |
0.59 |
| Q3-2107 |
0.49 |
0.52 |
0.32 |
0.59 |
| Q4-2017 |
0.49 |
0.51 |
0.32 |
0.59 |
| Q1-2018 |
0.49 |
0.51 |
0.32 |
0.58 |
| Q2-2018 |
0.41 |
0.39 |
0.21 |
0.58 |
| Q3-2018 |
0.41 |
0.38 |
0.21 |
0.58 |
| Q4-2018 |
0.41 |
0.38 |
0.21 |
0.58 |
Price reductions from Q4-2007 to Q4-2018:
| Country |
Generic price reduction |
| Sweden |
27% |
| Italy |
28% |
| Switzerland |
29% |
| France |
39% |
| United Kingdom |
52% |
| Germany |
53% |
| United States |
54% |
| OECD average |
42% |
| Canada: all generics |
59% |
| Canada: generics at 18% |
62% |
| Canada: generics at 10% |
79% |
3. Canadian generic prices are now more closely aligned with international levels
While the marked decline in generic prices in Canada between 2010 and 2017 narrowed the gap between Canadian and international levels, Canadian prices still remained higher, as prices were also declining in foreign markets. However, the latest generic policy changed the dynamic, dramatically reducing the gap between foreign and Canadian generic prices.
This is captured by the yearly change in foreign-to-Canadian price ratios, which compare generic prices in other countries to prices available in Canada. In 2010, for example, the median price of generics in the PMPRB7 countries was almost 50% lower than that in Canada. By 2017, median foreign levels were still 27% lower, but after the policy change in 2018, the gap was reduced to 13%. Mean PMPRB7 prices in 2018 were slightly higher than Canadian levels, mainly due to the influence of the average Swiss price, which is more than twice as high as any other PMPRB7 country.
Canadian generic prices are now 11th highest in the OECD, in line with Italy, the US, and France, and slightly above Germany, although generic prices in the UK and Sweden are still considerably lower. This is a vast improvement over the Q4-2016 ranking, when Canada ranked seventh highest in the OECD and prices in Germany, France, and Italy were approximately 25% lower.
Multilateral foreign-to-Canadian price ratios, PMPRB7, Q4-2010 to Q4-2018
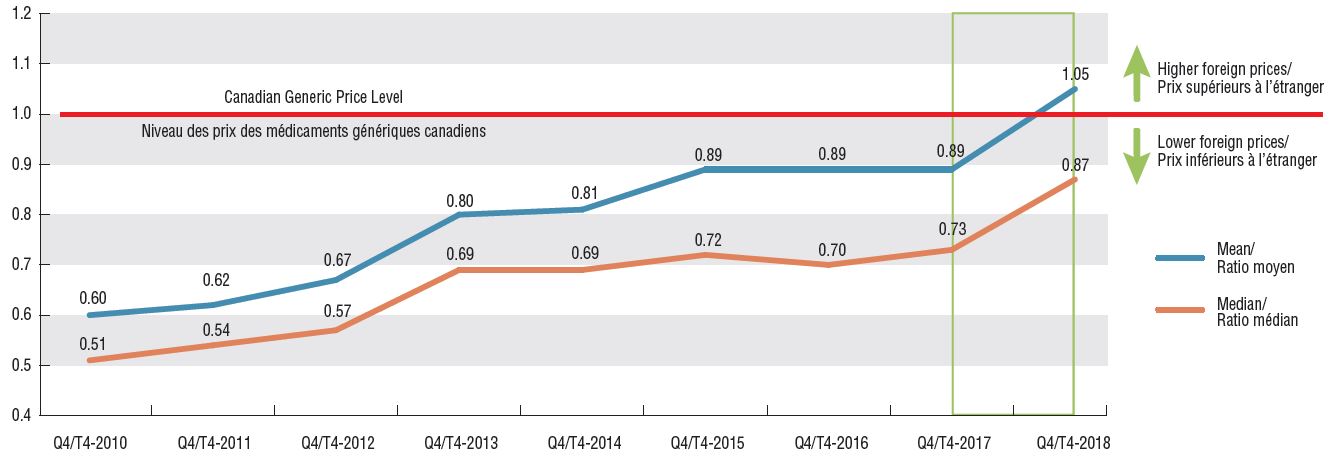
Figure description
This line graph gives the mean and median foreign-to-Canadian price ratios for the PMPRB7 from Q4-2010 to Q4-2018.
| |
Mean foreign-to-Canadian price ratio |
Median foreign-to-Canadian price ratio |
| Q4-2010 |
0.60 |
0.51 |
| Q4-2011 |
0.62 |
0.54 |
| Q4-2012 |
0.67 |
0.57 |
| Q4-2013 |
0.80 |
0.69 |
| Q4-2014 |
0.81 |
0.69 |
| Q4-2015 |
0.89 |
0.72 |
| Q4-2016 |
0.89 |
0.70 |
| Q4-2017 |
0.89 |
0.73 |
| Q4-2018 |
1.05 |
0.87 |
Bilateral foreign-to-Canadian price ratios, OECD, Q4-2018
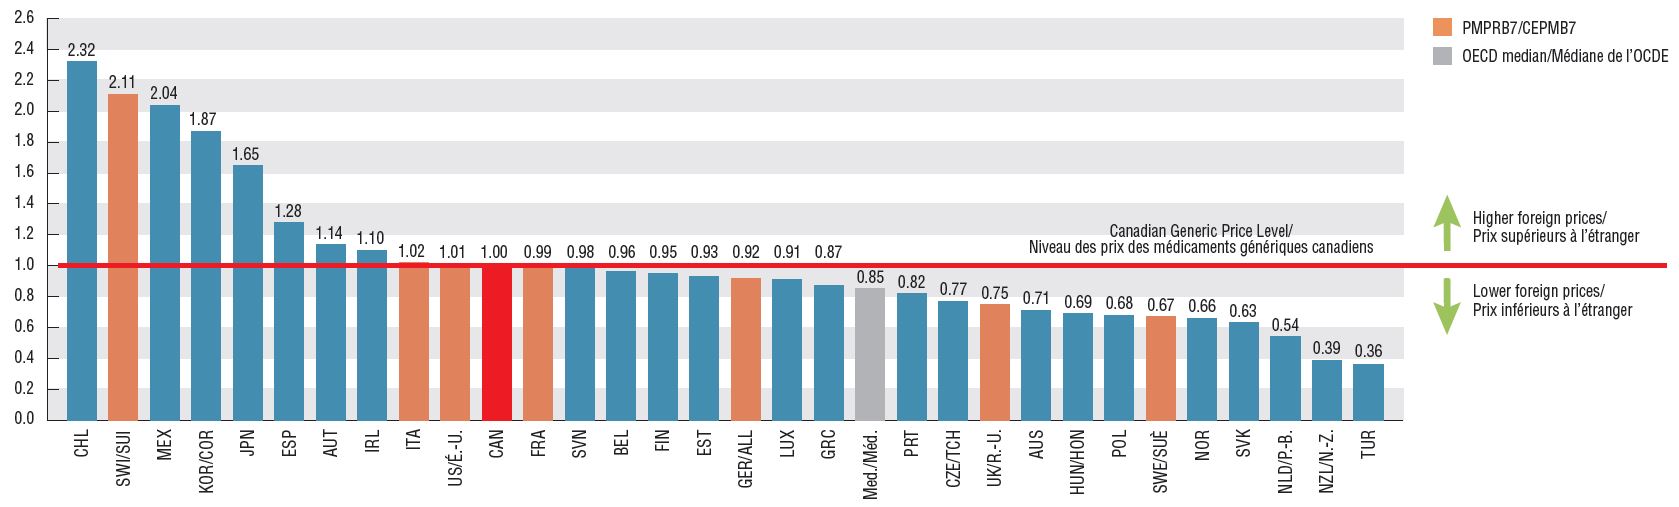
Figure description
This graph gives the average foreign-to-Canadian price ratio for each of the countries in the OECD in Q4-2018.
| Country |
Foreign-to-Canadian price ratio |
| Chile |
2.32 |
| Switzerland |
2.11 |
| Mexico |
2.04 |
| South Korea |
1.87 |
| Japan |
1.65 |
| Spain |
1.28 |
| Austria |
1.14 |
| Ireland |
1.10 |
| Italy |
1.02 |
| United States |
1.01 |
| Canada |
1.00 |
| France |
0.99 |
| Slovenia |
0.98 |
| Belgium |
0.96 |
| Finland |
0.95 |
| Estonia |
0.93 |
| Germany |
0.92 |
| Luxembourg |
0.91 |
| Greece |
0.87 |
| OECD Median |
0.85 |
| Portugal |
0.82 |
| Czech Republic |
0.77 |
| United Kingdom |
0.75 |
| Australia |
0.71 |
| Hungary |
0.69 |
| Poland |
0.68 |
| Sweden |
0.67 |
| Norway |
0.66 |
| Slovakia |
0.63 |
| Netherlands |
0.54 |
| New Zealand |
0.39 |
| Turkey |
0.36 |
4. Lower-priced generics made the greatest gain toward price alignment with international levels
Generic medicines with prices lowered to 10% of their brand-reference underwent the greatest level of improvement in comparative pricing over the last several years, from a 40% difference in median prices in 2016 to being on par in 2018. Those lowered to 18% of their brand-reference price also closed the gap between Canadian and international prices, although median foreign prices still remain 12% lower.
The shift in the share of generic sales by generic-to-brand ratio in Canada between Q4-2016 and Q4-2018 clearly demonstrates that the recent policy change greatly affected sales in the lower price ranges.
Cumulative generic sales by generic-to-brand price ratio, Q4-2016 and Q4-2018 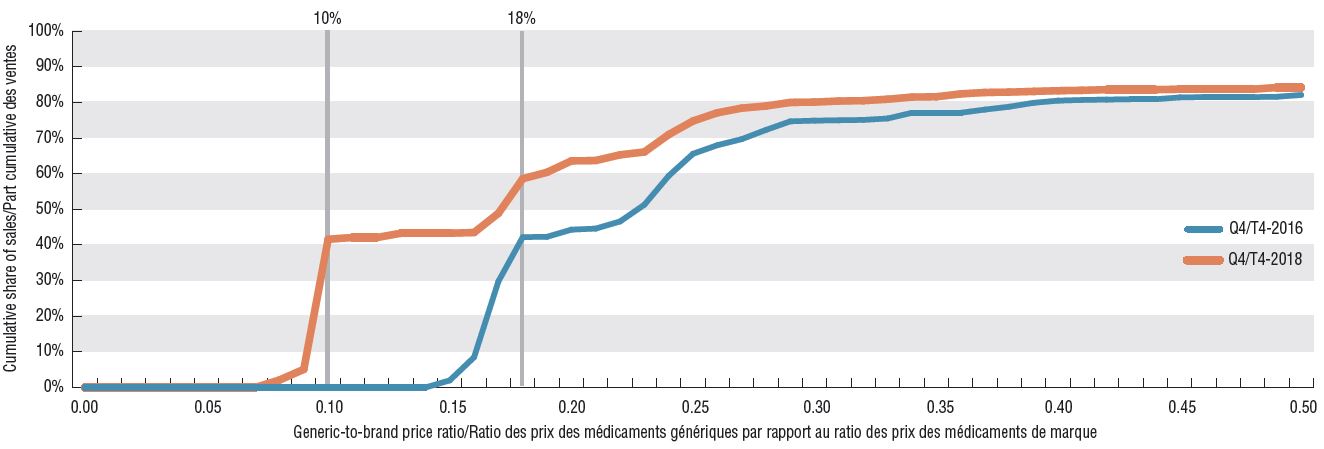
Figure description
This line graph illustrates the cumulative share of generic sales (by units) for generic-to-brand ratios from 1% to 50% in Q4-2016 and Q4-2018.
| Generic-to-brand price ratio |
Cumulative sales in Q4-2016 |
Cumulative sales in Q4-2018 |
| 1% |
0.0% |
0.0% |
| 2% |
0.0% |
0.0% |
| 3% |
0.0% |
0.0% |
| 4% |
0.0% |
0.0% |
| 5% |
0.0% |
0.0% |
| 6% |
0.0% |
0.0% |
| 7% |
0.0% |
0.0% |
| 8% |
0.0% |
2.1% |
| 9% |
0.0% |
5.1% |
| 10% |
0.0% |
41.6% |
| 11% |
0.0% |
42.1% |
| 12% |
0.0% |
42.1% |
| 13% |
0.0% |
43.3% |
| 14% |
0.0% |
43.3% |
| 15% |
2.0% |
43.3% |
| 16% |
8.5% |
43.5% |
| 17% |
29.8% |
48.9% |
| 18% |
42.2% |
58.6% |
| 19% |
42.3% |
60.4% |
| 20% |
44.3% |
63.6% |
| 21% |
44.6% |
63.7% |
| 22% |
46.6% |
65.3% |
| 23% |
51.3% |
66.1% |
| 24% |
59.4% |
71.0% |
| 25% |
65.6% |
74.8% |
| 26% |
68.0% |
77.1% |
| 27% |
69.7% |
78.4% |
| 28% |
72.3% |
79.0% |
| 29% |
74.7% |
80.0% |
| 30% |
74.9% |
80.1% |
| 31% |
75.0% |
80.4% |
| 32% |
75.1% |
80.5% |
| 33% |
75.5% |
80.9% |
| 34% |
77.1% |
81.5% |
| 35% |
77.1% |
81.6% |
| 36% |
77.1% |
82.4% |
| 37% |
78.0% |
82.8% |
| 38% |
78.8% |
82.9% |
| 39% |
79.9% |
83.1% |
| 40% |
80.5% |
83.3% |
| 41% |
80.7% |
83.4% |
| 42% |
80.8% |
83.6% |
| 43% |
80.9% |
83.6% |
| 44% |
80.9% |
83.6% |
| 45% |
81.4% |
83.7% |
| 46% |
81.5% |
83.7% |
| 47% |
81.5% |
83.7% |
| 48% |
81.5% |
83.7% |
| 49% |
81.6% |
84.2% |
| 50% |
82.1% |
84.2% |
Multilateral foreign-to-Canadian price ratios, PMPRB7 by market segment, Q4-2016 and Q2-2018 
Figure description
This set of three column graphs gives the mean and median foreign-to-Canadian price ratios for Q4-2016 and Q4-2018 for all generic medicines in Canada as well as for those at 18% and 10% of their brand-name reference price.
| |
Mean Q4-2016 |
Mean Q4-2018 |
Median Q4-2016 |
Median Q4-2018 |
| All generics |
0.91 |
1.05 |
0.72 |
0.87 |
| Generics at 18% |
0.92 |
1.02 |
0.72 |
0.57 |
| Generics at 10% |
0.78 |
1.25 |
0.60 |
0.98 |
Note: Unless otherwise specified, results reflect manufacturer ex-factory list prices reported in the national retail markets. Price indices are based on local currencies using country-specific sale weights. Average OECD prices and sales are determined by converting all currencies into US dollars.
Other factors, such as the change in the exchange rate may also influence foreign-to-Canadian price ratios over time.
Data source: IQVIA MIDAS™ Database. All rights reserved.
Disclaimer: Although based in part on data provided under license by the IQVIA MIDAS™ Database, the statements, findings, conclusions, views, and opinions expressed in this report are exclusively those of the PMPRB and are not attributable to IQVIA.