Market Intelligence Report: Biologic Response Modifier Agents, 2015
Acknowledgements
This report was prepared by the Patented Medicine Prices Review Board (PMPRB) as part of the National Prescription Drug Utilization Information System (NPDUIS).
The PMPRB would like to acknowledge the contributions of:
- The members of the NPDUIS Advisory Committee for their expert oversight and guidance in the preparation of this report.
- The PMPRB staff for their contribution to the analytical content of the report:
- Tanya Potashnik – Director, Policy and Economic Analysis
- Elena Lungu – Manager, NPDUIS
- Jeffrey Biggs – Manager, Policy
- Nevzeta Bosnic – Senior Economic Analyst
- Eiad El Fateh – Senior Economic Analyst
- Gary Warwick – Senior Economic Analyst
- Karine Landry – Economic Analyst
- Dan Roumelis – Senior Data Analyst
- Carol McKinley – Publications Advisor
Disclaimer
NPDUIS is a research initiative that operates independently of the regulatory activities of the Board of the PMPRB. The statements and opinions expressed in this report do not represent the position of the PMPRB with respect to any regulatory matter.
Parts of this material are based on data obtained from the Canadian Institute for Health Information (CIHI) and under license from IMS AG’S MIDAS™ Database, the IMS Brogan Payer Insight Database, and the IMS Brogan Private Drug Plan Database. However, the statements, findings, conclusions, views and opinions expressed in this report are exclusively those of the PMPRB and are not attributable to CIHI, IMS AG, or IMS Brogan.
Contact Information
Patented Medicine Prices Review Board
Standard Life Centre
Box L40
333 Laurier Avenue West
Suite 1400
Ottawa, ON K1P 1C1
Telephone: 1-877-861-2350
TTY: 613-288-9654
Email: PMPRB.Information-Renseignements.CEPMB@pmprb-cepmb.gc.ca
Executive Summary
The PMPRB Market Intelligence Report series provides detailed information on specific therapeutic market segments of importance to Canadians. These targeted analyses are designed to inform policy discussions, aid in evidence-based decision making, and provide Canadians with a more comprehensive view of issues pertaining to pharmaceutical drug pricing and utilization in Canada and internationally.
This first report in the series explores the market for a select number of biologic response modifying agents: Enbrel, Remicade, Kineret, Humira, Rituxan, Orencia, Simponi, Cimzia and Actemra. While these drugs are commonly used in the treatment of rheumatoid arthritis and related inflammatory rheumatic conditions, several are also used to treat other conditions such as moderate to severe plaque psoriasis and inflammatory bowel disease. The data reported does not distinguish between indications and includes the drug use and costs associated with all disease therapies. Throughout the analysis these drugs are referred to as biologic disease-modifying antirheumatic drugs or biologic DMARDs.
The market for biologic DMARDs has been rapidly evolving over the last two decades, with new drugs and indications continuously reshaping it and fueling a remarkable growth both domestically and internationally. This edition of the PMPRB Market Intelligence Report focuses a lens on this class of drugs, providing insight into the uptake in utilization, market shares, pricing, annual treatment costs and the broader drug portfolio of the manufacturers operating in this space. The report explores Canadian markets from the national and public and private payer perspectives, positioning them within an international context.
International comparisons focus on the seven countries the PMPRB considers in reviewing the prices of patented drugs (PMPRB7): France, Germany, Italy, Sweden, Switzerland, the United Kingdom (UK) and the United States (US). Some of the analyses also include other countries in the Organisation for Economic Co-operation and Development (OECD). The report focuses on the 2015 calendar year and provides a retrospective look at trends since 2010. Foreign and Canadian national sales and prices are based on list prices and do not capture off-invoice price rebates and allowances, managed entry agreements, or patient access schemes.
Key Findings
The sales and use of biologic DMARDs are higher in Canada than in most comparable international markets
- Biologic DMARDs accounted for 10.3% of the Canadian pharmaceutical market in 2015. This market share was higher than in almost all the PMPRB7 countries (ranging from 4.1% to 7.7%); Sweden was the only exception at 11.6%.
- The growth in Canadian sales of biologic DMARDs nearly doubled from 2010 to 2015. This increase was greater than in all of the PMPRB7 countries except for the US.
- Canada has one of the highest per capita consumption rates of biologic DMARDs compared to the PMPRB7 countries.
Canadians primarily use biologic DMARDs with the highest domestic treatment costs
- The three top-selling biologic DMARDs in Canada, which accounted for over three quarters of the sales in 2015, had the highest average annual costs per patient. Based on public plan data, the average annual costs of Remicade ($27.3K), Humira ($15.8K) and Enbrel ($14.9K) were significantly higher than other drugs in this class (ranging from $11.5K to $13.4K).
- The Canadian market for biologic DMARDs is still dominated by the first few higher-cost entrants, despite competition from several subsequent market entrants with lower treatment costs.
The top-selling biologic DMARD, Remicade, has the highest annual cost per patient and list price in Canada
- Remicade accounted for nearly 40% of the Canadian market for biologic DMARDs and cost close to 50% more per patient than the class average based on 2015 public drug plan data.
- The market share for Remicade was much lower in the PMPRB7 countries, ranging from 12% to 23% in 2015, with a median list price 25% less than in CanadaFootnote 1. This price difference translates into $224 million in drug sales or 1.0% of the entire Canadian pharmaceutical market.
- While the price of the biosimilar for Remicade in Canada is in line with the median OECD level, the uptake in sales has been relatively modest to date. If the use of the biosimilar in Canada had mirrored the median OECD use in 2015 (10.1%), it would have translated into a $41.7 million reduction in drug expenditures. Similarly, if the biosimilar uptake in Canada was in line with that of Norway (the country with the lowest biosimilar price and one of the highest uptakes at 67.8%), the cost implications would be substantial: a reduction of $280.1 million in drug expenditures, or 1.3% of the entire pharmaceutical market in Canada.
Canadian public and private drug plans pay for most of the costs related to biologic DMARDs
- Given the relatively high cost of biologic DMARDs, over 90% of the costs are reimbursed through either public or private plans, with a balanced split.
- Both the public and private market segments have had a remarkable growth in the total cost of biologic DMARDs in recent years, mainly fueled by the top-selling drug Remicade.
- Several manufacturers of biologic DMARDs draw important revenues from the public payer market. For example, in 2015, the entire portfolio of products from Janssen Inc., the manufacturer of Remicade, represented 6.0% to 12.3% of all public drug plan costs, depending on the plan.
Data Sources: The main data sources for international, Canadian national, and Canadian public and private drug plans include IMS AG’s MIDAS™ Database (All rights reserved); the Canadian Institute for Health Information’s NPDUIS Database; IMS Brogan’s Private Drug Plan Database; IMS Brogan’s Payer Insight Database; and the PMPRB Human Drug Advisory Panel reviews. Additional data was taken from Health Canada’s Drug Product Database; the European Medicines Agency’s orphan drug database; the Canadian Agency for Drugs and Technologies in Health (CADTH) Common Drug Review reports; and the United Nation’s world population statistics.
Introduction
The amount spent on biologic drugs has markedly increased over the last two decades, putting considerable pressure on Canadian and international drug spending. In particular, biologic response modifying agents primarily used in the treatment of rheumatoid arthritis are a rapidly evolving class, with new indications and drug entrants continually reshaping the market landscape.
This edition of the PMPRB Market Intelligence Report series examines the Canadian and international markets for these drugs and provides insight into the uptake in utilization, market shares, pricing, and annual treatment costs.
This class of drugs includes Enbrel, Remicade, Kineret, Humira, Rituxan, Orencia, Simponi, Cimzia and Actemra. While these drugs are commonly used in the treatment of rheumatoid arthritis and related inflammatory rheumatic conditions, several are also used to treat other conditions such as moderate to severe plaque psoriasis and inflammatory bowel disease. The data reported does not distinguish between indications and includes the drug use and costs associated with all disease therapies. Throughout the analysis these drugs are referred to as biologic disease-modifying antirheumatic drugs or biologic DMARDs.
The report offers a comprehensive view of domestic markets including the national Canadian market and public and private payers. It explores the cost implications for Canadians based on domestic and international markets and prices, and describes the drug portfolios of the manufacturers operating in this space. The report also provides a brief overview of the availability and pricing of biosimilars (also known as subsequent entry biologics or SEBs). The analysis focuses on the 2015 calendar year and provides a retrospective look at trends since 2010.
This study provides key information to help to inform policy discussions and aid in evidence-based decision making. Given the high use and cost of biologic DMARDs in Canada, the results will be of interest to many Canadians.
Methods
The analysis focuses on biologic DMARDs used in the treatment of rheumatoid arthritis and related inflammatory rheumatic conditions. Drugs were selected for analysis based on the PMPRB Human Drug Advisory Panel (HDAP) scientific reviews, which identify the therapeutic comparators used in disease treatment. The reviews are conducted for the purpose of the PMPRB's price review processes.
These drugs include tumor necrosis factor (TNF) inhibitors—adalimumab (Humira), etanercept (Enbrel), infliximab (Remicade), golimumab (Simponi), and certolizumab (Cimzia); a T cell costimulatory inhibitor—abatacept (Orencia); a B lymphocyte-depleting agent—rituximab (Rituxan); an interleukin-6 antagonist—tocilizumab (Actemra); and an interleukin-1 inhibitor—anakinra (Kineret). Most of these drugs have also been approved for other indications such as plaque psoriasis and inflammatory bowel disease, while Rituxan is primarily used for the treatment of cancer. The study does not include the recently introduced oral medication tofacitinib (Xeljanz), which is a Janus associated kinase (JAK) inhibitor. The sales for this novel, small-molecule (non-biologic) inhibitor were insignificant in the study period.
The international comparisons focus on the seven countries the PMPRB considers in reviewing the prices of patented drugs (PMPRB7): France, Germany, Italy, Sweden, Switzerland, the United Kingdom and the United States. Some of the analysis is also extended to include additional countries in the Organisation for Economic Co-operation and Development (OECD).
Measures of the foreign-to-Canadian price ratios for biologic DMARDs are calculated for a variety of bilateral and multilateral measures of foreign price. Bilateral price ratios compare the price levels for an individual country to prices available in Canada, while multilateral ratios compare the prices across all countries analyzed to those available in Canada. Appendix B provides a detailed description of how the average foreign-to-Canadian price ratios are calculated.
Canadian and international measures of per capita drug consumption are also reported. Biologic DMARD consumption rates are determined by converting the physical quantity of drugs sold in any given market into annual treatment doses per patient and expressing the result on a per million inhabitant basis. Annual treatment doses are based on the PMPRB HDAP estimates, which consider information from clinical trials, product monographs and other relevant guidelines.
The following data sets were used in this report:
- IMS AG’s MIDAS™ Database (All Rights Reserved)
- This database contains information on Canadian and international drug sales, list prices and utilization. The data reflects prescription drug sales in both the retail and the hospital market sectors, and includes sales in all market segments (public, private and out-of-pocket). Canadian and international sales and pricing information are based on manufacturer ex-factory prices. Foreign currencies are converted to Canadian dollars using the 12-month average exchange rate for the year indicated.
- National Prescription Drug Utilization Information System (NPDUIS) Database, Canadian Institute for Health Information
- This database houses pan-Canadian information on public drug programs, including anonymous claims-level data collected from the plans participating in the NPDUIS initiative: British Columbia, Alberta, Saskatchewan, Manitoba, Ontario, New Brunswick, Nova Scotia, Prince Edward Island, and Newfoundland and Labrador, as well as Health Canada’s Non-Insured Health Benefits (NIHB) drug plan. The totals reported include data from all of the NPDUIS plans.
- IMS Brogan Private Drug Plan Database
- This database houses anonymous claims-level data collected from a large sample of Canadian pay-direct private drug plans, capturing an estimated 85.7% of the national private payer market. All Canadian provinces and territories are included in this dataset.
- IMS Brogan Payer Insight Database
- This database reports on Canadian national and provincial drug sales at the pharmacy level, and provides information on the number of physical quantities, prescriptions and drug cost. The data identifies the payer of a prescription as the plan or individual that contributed the largest portion of the cost of a claim, and allocates the entire amount to that payer.
- PMPRB Human Drug Advisory Panel (HDAP) reviews
- HDAP reviews and evaluates information on new patented drug products at introduction to the Canadian market and recommends the level of therapeutic improvement for PMPRB price regulation. PMPRB HDAP information is used in this report to identify relevant drugs in the biologic DMARD market and compare their annual treatment cost based on the recommended doses.
- Additional data sources
- Other data sources include Health Canada’s Drug Product Database, the European Medicines Agency’s orphan drug database, the Canadian Agency for Drugs and Technologies in Health (CADTH) Common Drug Review (CDR) reports, and the United Nations’ world population statistics.
Limitations
Information on the use of specific biologic DMARDs by indication was not available for the purpose of this study, and the results of the trend analyses, as well as international and Canadian comparisons by market segment, encompass the data for all indications for which these drugs are prescribed.
Foreign and Canadian national sales and prices are based on manufacturer list prices and do not capture off-invoice price rebates and allowances, managed entry agreements, or patient access schemes.
Drug costs reported for public and private drug plans are the amounts accepted toward reimbursement and do not reflect off-invoice price rebates or price reductions resulting from confidential product listing agreements.
Depending on the country, biologic DMARDs may be dispensed through the retail or hospital sectors or a combination of both. The list prices reported here may vary depending on the differences between the procurement processes in the retail and hospital sectors; procuring drugs through the hospital sector generally results in lower prices and greater efficiency.
List prices may also vary across countries depending on the delivery channels. In the case of Remicade, for instance, infusions in Canada are almost exclusively delivered in manufacturer-sponsored infusion centers, while in other countries the infusions are generally delivered in hospitals.
The totals for the Canadian public drug plans analyzed are heavily skewed by Ontario due to its size.
1. Drug Status in Canada
The first biologic DMARDs were approved for the treatment of rheumatoid arthritis (RA) and related inflammatory rheumatic conditions in Canada in the early 2000s, after being issued notices of compliance (NOCs) by Health Canada. The early entrants, such as Enbrel (NOC 2000), Remicade (NOC 2001) and Humira (NOC 2004), have consistently held more than three quarters of the market. Currently, there are nine drugs in this class available in Canada, which are described in Table 1.1.
Table 1.1 Summary of drug information for biologic DMARDs in Canada
| |
Enbrel |
Remicade |
Kineret |
Humira |
Rituxan* |
Orencia |
Simponi |
Cimzia |
Actemra† |
| First NOC |
2000/12/01 |
2001/06/06 |
2002/05/24 |
2004/09/24 |
2006/06/16 (RA)§ |
2006/06/29 |
2009/04/07 |
2009/08/12 |
IV: 2010/04/30
SC: 2014/05/06 |
| Patentee |
Amgen Canada Inc. |
Janssen Inc. |
Swedish Orphan Biovitrum AB, Sobi |
AbbVie |
Hoffmann-La Roche Limited |
Bristol-Myers Squibb Canada Co. |
Janssen Inc. |
UCB Canada Inc. |
Hoffmann-La Roche Limited |
| Market share (2015) |
15.0% |
39.4% |
0.1% |
25.1% |
10.2% |
2.4% |
4.8% |
1.4% |
1.7% |
| Molecule |
Etanercept |
Infliximab |
Anakinra |
Adalimumab |
Rituximab |
Abatacept |
Golimumab |
Certolizumab pegol |
Tocilizumab |
| Indications‡ |
Adult RA, PsA, AS, pJIA, chronic moderate to severe PP |
RA, AS, CD, UC, PsA, PP |
Adult RA |
RA, JIA, PsA, AS, aCD, pCD, UC, PP, HS |
NHL, CLL, RA, MPA, GPA |
Adult RA, juvenile RA, JIA |
RA, PsA, AS, UC |
RA, PsA, AS |
IV and SC: RA
IV: pJIA, sJIA |
| Strength |
25 mg/kit
50 mg/mL |
100 mg/vial |
100 mg syringe
150 mg/mL |
40 mg/0.8 mL |
10 mg/mL |
250 mg/vial
125 mg/mL |
50 mg/0.5 mL
100 mg/1 mL
50 mg/4 mL |
200 mg/mL |
IV: 80 mg/4 mL
200 mg/10 mL
400 mg/20 mL
SC: 162 mg/ 0.9 mL |
| Form |
Prefilled syringe |
Infusion |
Prefilled syringe |
Prefilled syringe |
Infusion |
Prefilled syringe/ infusion |
Prefilled syringe/ infusion |
Prefilled syringe |
Prefilled syringe/ infusion |
*Rituxan is also known as MabThera/Zytux outside Canada.
†IV, intravenous; SC, subcutaneous.
§On 2000-03-17 an NOC was received for a primary indication for cancer.
‡aCD: adult Crohn’s disease; AS: ankylosing spondylitis; CLL: chronic lymphocytic leukemia; GPA: granulomatosis with polyangiitis (GPA); HS: hidradenitis suppurativa; JIA: juvenile idiopathic arthritis; MPA: microscopic polyangiitis; NHL: non-Hodgkin’s lymphoma; pCD: pediatric Crohn’s disease; pJIA: polyarticular juvenile idiopathic arthritis; PP: plaque psoriasis; PsA: psoriatic arthritis; RA: rheumatoid arthritis; sJIA, systemic juvenile idiopathic arthritis; and UC: ulcerative colitis. |
Table 1.2 reports on the recommendations, assessments and reimbursement decisions for biologic DMARDs in Canada, which appear to be fairly uniform across the drugs. While the initial market entrants received a breakthrough or substantial level of therapeutic improvement designation from the PMPRB’s scientific review, subsequent entrants received a moderate, slight or no improvement categorization.
The Canadian Agency for Drugs and Technologies in Health (CADTH) Common Dug Review (CDR) evaluated all but two of the drugs (Enbrel and Kineret), and issued the same recommendation to Canada’s public drug plans: list with criteria or conditions.
Biologic DMARDs are broadly covered by all public drug plans; each plan lists at least some of the drugs in this class on their formularies. The pan-Canadian Pharmaceutical Alliance (pCPA), which was created in 2010 to achieve greater value for brand-name and generic drugs for publicly funded drug programs, has completed negotiations for three of the biologic DMARDs (for most indications)—Remicade, Orencia and Actemra. As of June 30, 2016, the pCPA was in ongoing negotiations for Simponi and Humira for ulcerative colitis (UC), while negotiations for Humira and Actemra for polyarticular juvenile idiopathic arthritis (pJIA) were being considered separately by each province/territory.
Most of the biologic DMARDs have an approved orphan designation in the United States, but not in Europe.
While all biologic DMARDs continue to have valid patents and, thus, fall under the PMPRB’s jurisdiction, biosimilars are emerging. Biosimilars for infliximab are available in several countries including Canada; a biosimilar for Enbrel (Benpali) recently received approval in the European Union (EU); and a biosimilar for Humira (ABP 501) is currently under review by the US Food and Drug Administration.
Table 1.2 Recommendations, assessments, and reimbursement decisions for biologic DMARDs in Canada
| |
Enbrel |
Remicade |
Kineret |
Humira |
Rituxan |
Orencia |
Simponi |
Cimzia |
Actemra* |
| PMPRB HDAP† |
B/S (RA) |
B/S (CD) |
S/N |
S/N |
B/S (NHL) |
Mod |
S/N |
S/N |
IV: S/N
SC: Mod (RA) |
| CDR review‡ |
– |
LWCC |
‒ |
LWCC |
LWCC |
LWCC |
LWCC |
LWCC |
LWCC |
| Restricted access in public drug plans§ |
All |
All |
AB, SK, MB, ON |
All |
All |
All |
All |
All |
All |
| pCPA status of negotiations** |
– |
Complete |
‒ |
Ongoing/individual |
‒ |
Complete |
Ongoing |
Ongoing |
Complete/ongoing |
| Orphan approval in the US†† |
Yes |
Yes |
Yes |
Yes |
Yes |
No |
No |
No |
Yes |
| Biosimilars available |
Canada |
No |
Yes |
No |
No |
No |
No |
No |
No |
No |
| The World |
Yes (EU) |
Yes |
No |
Under US FDA review |
No |
No |
No |
No |
No |
Note: Orencia was listed in the moderate improvement category by the PMPRB, since it was as effective as other treatments, but had fewer serious adverse events.
*IV, intravenous; SC, subcutaneous.
†PMPRB Human Drug Advisory Panel (HDAP) assessment of degree of therapeutic improvement: B/S, breakthrough/substantial improvement; S/N, slight or no improvement; Mod, moderate improvement. CD, Crohn’s disease; NHL, non-Hodgkin’s lymphoma; RA, rheumatoid arthritis.
‡Canadian Agency for Drugs and Technologies in Health (CADTH) Common Dug Review (CDR) evaluation: LWCC, list with criteria or conditions.
§Public plans in Canada do not provide unrestricted access to any of the biologic DMARDs.
**pCPA, pan-Canadian Pharmaceutical Alliance. Negotiations can be undertaken collectively by the pCPA members or individually by the provinces.
††As of December 31, 2015, none of the biologic DMARDs had received an approved orphan indication in the European Union. |
2. International Market Overview
Compared to international markets, biologic DMARDs in Canada have one of the highest rates of growth in sales and have captured one of the highest market shares. Canada also has a relatively high per capita consumption rate of biologic DMARDs.
While biologic DMARDs are a growing market segment in all of the countries included in this analysis, Canada has one of the highest rates of growth in sales. Over the last six years, sales in Canada have nearly doubled, from $1.1 billion in 2010 to $2.2 billion in 2015 (Figure 2.1), representing a compound annual growth rate (CAGR) of 14.6%. Over the last decade, the cumulative sales of biologic DMARDs in Canada reached $12.7B, accounting for 5.2% of the total $246.2B in sales in the PMPRB7 countries and Canada.
Figure 2.1 Biologic DMARDs sales* index
Canada and PMPRB7†, 2010 to 2015
Click on image for larger view
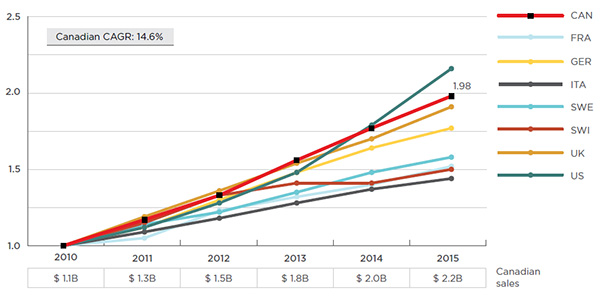
Figure description
This line graph depicts the growth in the sales of biologic DMARDs in Canada and the PMPRB7 from 2010 to 2015. The sales values are indexed to start at a value of one in 2010 and are as follows:
blank
|
2010 |
2011 |
2012 |
2013 |
2014 |
2015 |
| Canada |
1.00 |
1.17 |
1.33 |
1.56 |
1.77 |
1.98 |
| France |
1.00 |
1.05 |
1.23 |
1.32 |
1.40 |
1.52 |
| Germany |
1.00 |
1.12 |
1.30 |
1.48 |
1.64 |
1.77 |
| Italy |
1.00 |
1.09 |
1.18 |
1.28 |
1.37 |
1.44 |
| Sweden |
1.00 |
1.14 |
1.22 |
1.35 |
1.48 |
1.58 |
| Switzerland |
1.00 |
1.15 |
1.33 |
1.41 |
1.41 |
1.50 |
| United Kingdom |
1.00 |
1.19 |
1.36 |
1.54 |
1.70 |
1.91 |
| United States |
1.00 |
1.12 |
1.28 |
1.48 |
1.79 |
2.16 |
Canada had a compound annual growth rate of 14.6%.
The yearly sales of biologic DMARDs in Canada are given in a small table at the bottom of the graph:
2010: $1.1 billion;
2011: $1.3 billion;
2012: $1.5 billion;
2013: $1.8 billion;
2014: $2.0 billion;
2015: $2.2 billion.
*Manufacturer price levels.
†France, Germany, Italy, Sweden, Switzerland, the United Kingdom and the United States.
Source: MIDAS™ Database, prescription retail and hospital markets, 2010 to 2015, IMS AG. All rights reserved.
In Canada, biologic DMARDs accounted for a sizable share of the total pharmaceutical market in 2015 (10.3%). This was the second highest share amongst the PMPRB7 countries after Sweden (11.6%), as illustrated in Figure 2.2.
Figure 2.2 Biologic DMARD market shares of total pharmaceutical sales*
Canada and PMPRB7†, 2010 to 2015
Click on image for larger view
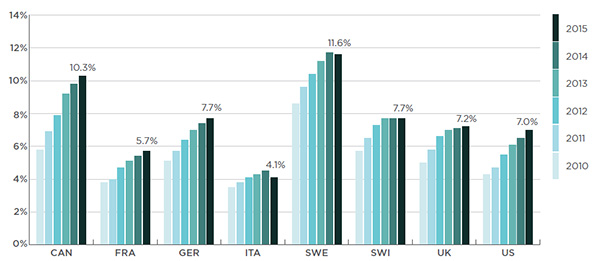
Figure description
This bar graph depicts the biologic DMARD market share of total pharmaceutical sales for Canada and the PMPRB7 countries from 2010 to 2015:
blank
| |
2010 |
2011 |
2012 |
2013 |
2014 |
2015 |
| Canada |
5.8% |
6.9% |
7.9% |
9.2% |
9.8% |
10.3% |
| France |
3.8% |
4.0% |
4.7% |
5.1% |
5.4% |
5.7% |
| Germany |
5.1% |
5.7% |
6.4% |
7.0% |
7.4% |
7.7% |
| Italy |
3.5% |
3.8% |
4.1% |
4.3% |
4.5% |
4.1% |
| Sweden |
8.6% |
9.6% |
10.4% |
11.2% |
11.7% |
11.6% |
| Switzerland |
5.7% |
6.5% |
7.3% |
7.7% |
7.7% |
7.7% |
| United Kingdom |
5.0% |
5.8% |
6.6% |
7.0% |
7.1% |
7.2% |
| United States |
4.3% |
4.7% |
5.5% |
6.1% |
6.5% |
7.0% |
*Manufacturer price levels.
†France, Germany, Italy, Sweden, Switzerland, the United Kingdom and the United States.
Source: MIDAS™ Database, prescription retail and hospital markets, 2010 to 2015, IMS AG. All rights reserved.
In terms of utilization, Canada’s share of the international market for biologic DMARDs has also increased over time. In 2015, the Canadian market accounted for 6.3% of the total physical units of biologic DMARDs sold in the PMPRB7 countries and Canada, increasing from 4.9% over a six-year period.
To examine the use of biologic DMARDs in more depth, an analysis of the foreign-to-Canadian per capita drug consumption is reported in Figure 2.3. Consumption rates are determined by converting the quantity of drugs sold in a country into annual treatment doses per patient reported on a per million inhabitant basis. The results are presented as an index, with the consumption rate in Canada set equal to one, and the rates in other countries determined relative to this measure. The annual maintenance treatment doses are based on PMPRB HDAP reviewsFootnote 2.
Figure 2.3 Foreign-to-Canadian per capita consumption* of biologic DMARDs
Canada and PMPRB7†, 2015
Click on image for larger view
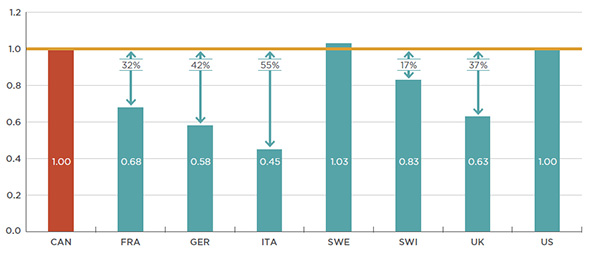
Figure description
This bar graph compares the 2015 foreign-to-Canadian per capita consumption of biologic DMARDs for the PMPRB7 countries. The results are presented as an index with the Canadian rate of consumption set to a value of one. Each country is represented by a separate bar: France: 0.68 (32% less than Canada); Germany: 0.58 (42% less); Italy: 0.45 (55% less); Sweden: 1.03 (3% more); Switzerland: 0.83 (17% less); United Kingdom: 0.63 (37% less); United States: 1.00 (same as Canada).
*Based on the PMPRB Human Drug Advisory Panel (HDAP) annual maintenance treatment dose per patient.
†France, Germany, Italy, Sweden, Switzerland, the United Kingdom and the United States.
Source: MIDAS™ Database, prescription retail and hospital markets, 2015, IMS AG. All rights reserved.
While Canada’s per capita rate of consumption of biologic DMARD treatments was comparable to that of Sweden and the United States, the rates were much lower in the remaining five PMPRB7 countries, ranging from 17% lower in Switzerland to 55% lower in Italy. The variation among countries may be due to differences in the demographic and disease profiles of the populations, but may also reflect the uptake of biologic DMARDs, as opposed to other treatment options, as well as the affordability of these higher-cost drugs.
Canada’s relatively high per capita consumption rate of biologic DMARDs increases the impact of foreign-to-Canadian price differentials and the availability of biosimilars in the Canadian market.
Canada has the highest cost concentration of biologic DMARDs amongst the PMPRB7 countries, with three of the top-selling drugs in this class accounting for 79.5% of the Canadian sales. This high cost concentration is due to Remicade’s 39.4% market share, which is much greater than in any of the other markets analyzed, where it ranges from 11.9% to 23.1% – see Figure 2.4.
Figure 2.4 Distribution of sales by biologic DMARD
Canada and PMPRB7*, 2015
Click on image for larger view
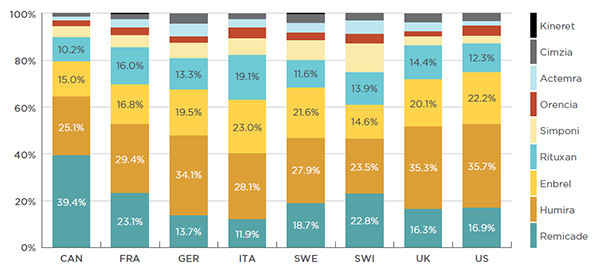
Figure description
This bar graph gives the 2015 sales of each drug as a percentage of the total biologic DMARD sales for Canada and each of the PMPRB7 countries:
blank
|
Remicade |
Humira |
Enbrel |
Rituxan |
Simponi |
Orencia |
Actemra |
Cimzia |
Kineret |
| Canada |
39.4% |
25.1% |
15.0% |
10.2% |
4.8% |
2.4% |
1.7% |
1.4% |
0.1% |
| France |
23.1% |
29.4% |
16.8% |
16.0% |
5.1% |
3.2% |
3.6% |
2.2% |
0.5% |
| Germany |
13.7% |
34.1% |
19.5% |
13.3% |
6.4% |
2.7% |
5.7% |
4.2% |
0.3% |
| Italy |
11.9% |
28.1% |
23.0% |
19.1% |
6.9% |
4.7% |
3.7% |
2.2% |
0.4% |
| Sweden |
18.7% |
27.9% |
21.6% |
11.6% |
8.5% |
3.4% |
4.0% |
3.9% |
0.5% |
| Switzerland |
22.8% |
23.5% |
14.6% |
13.9% |
12.2% |
4.2% |
5.7% |
3.1% |
0.0% |
| United Kingdom |
16.3% |
35.3% |
20.1% |
14.4% |
4.0% |
2.2% |
3.6% |
3.9% |
0.2% |
| United States |
16.9% |
35.7% |
22.2% |
12.3% |
3.1% |
4.5% |
1.9% |
3.4% |
0.1% |
*France, Germany, Italy, Sweden, Switzerland, the United Kingdom and the United States.
Source: MIDAS™ Database, prescription retail and hospital markets, 2015, IMS AG. All rights reserved.
Over the past decade, the cumulative sales of Remicade in Canada mounted to $4.8B, representing 9.0% of the total sales in Canada and the PMPRB7 countries combined (Table 2.1).
Table 2.1 Biologic DMARDs cumulative sales* from 2006 to 2015
Canada and PMPRB7†
| |
Canada |
PMPRB7 and Canada |
Canada's share |
| Remicade |
$4.8B |
$53.2B |
9.0% |
| Humira |
$2.7B |
$66.0B |
4.1% |
| Enbrel |
$2.7B |
$61.4B |
4.3% |
| Rituxan |
$1.7B |
$43.0B |
4.0% |
| Simponi |
$0.4B |
$5.2B |
6.7% |
| Orencia |
$0.2B |
$8.3B |
2.9% |
| Actemra |
$0.1B |
$3.6B |
3.5% |
| Cimzia |
$0.1B |
$4.8B |
2.0% |
| Kineret |
$0.0B |
$0.6B |
4.1% |
| Total |
$12.7B |
$246.2B |
5.2% |
*Manufacturer price levels.
†France, Germany, Italy, Sweden, Switzerland, the United Kingdom and the United States.
Source: MIDAS™ Database, prescription retail and hospital markets, 2006 to 2015, IMS AG. All rights reserved.
|
As shown in Figure 2.5, biologic DMARDs are dispensed through the retail or hospital sectors, or a combination of both, depending on the country. Although most countries mainly dispense these drugs through the retail sector, Canada’s retail market share is particularly high (90% of the sales). In contrast, in Italy and the United Kingdom, biologic DMARDs are only dispensed through the hospital sector (100%).
Figure 2.5 Share of biologic DMARDs dispensed in retail versus hospital sectors
Canada and PMPRB7*, 2015
Click on image for larger view
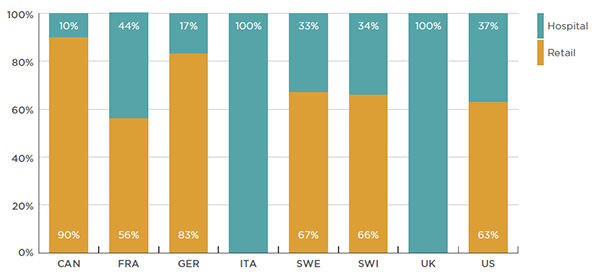
Figure description
This bar graph depicts the 2015 share of biologic DMARDs dispensed in the hospital and retail sectors for Canada and the PMPRB7 countries:
- Canada: hospital, 10%; retail, 90%
- France: hospital, 44%; retail, 56%
- Germany: hospital, 17%; retail, 83%
- Italy: hospital, 100%; retail, 0%
- Sweden: hospital, 33%; retail, 67%
- Switzerland: hospital, 34%; retail, 66%
- United Kingdom: hospital, 100%; retail, 0%
- United States: hospital, 37%; retail, 63%
*France, Germany, Italy, Sweden, Switzerland, the United Kingdom and the United States.
Source: MIDAS™ Database, prescription retail and hospital markets, 2015, IMS AG. All rights reserved.
The procurement processes in the retail and the hospital sectors generally differ. Procuring biologic DMARDs through the hospital sector usually allows countries to take advantage of lower prices and greater efficiency.
A closer look at the countries that provide biologic DMARDs through both the retail and the hospital sectors suggests that the breakdown between these two market segments varies depending on the method of drug administration. Drugs that come in a prefilled syringe (e.g., Enbrel and Humira) are almost entirely dispensed in retail settings; whereas, there is more variability for drugs delivered by infusion (e.g., Remicade, Orencia and Actemra). While infusion drugs are generally provided through the hospital sector in most of the foreign markets, they are mainly dispensed through the retail sector in CanadaFootnote 3 and Germany (97% and 68% of Remicade infusions, respectively).
3. Canadian Market Overview: National and Payer Markets
At a national level, over 90% of the costs related to biologic DMARDs are reimbursed through public or private drug plans, with a balanced split between the two. Both the public and private market segments have experienced a remarkable growth in this drug class in recent years, mainly fueled by an increase in the number of beneficiaries being treated.
There are significant variations in the treatment costs of biologic DMARDs. Despite the introduction and availability of newer, lower-cost options, the market continues to be dominated by the three early entrants with the highest treatment costs: Remicade, Humira and Enbrel. In particular, Remicade, which accounts for over 40% of the public drug plan market, costs close to 50% more per patient than the class average.
National Market
While the sales of biologic DMARDs in Canada have nearly doubled (98% total growth) over the last six years, the increase has been mainly fueled by Remicade (41% of total) and Humira (29% of total) – see Figure 3.1. Despite new treatments entering the market, these two drugs have grown at a faster pace over this time period (with rates of growth of 110% and 136%, respectively) than the rest of the biologic DMARDs and, as a result, have been capturing an increasing share of the market.
Figure 3.1 Trends in Canadian sales* of biologic DMARDs, by drug product, 2010 to 2015
Click on image for larger view
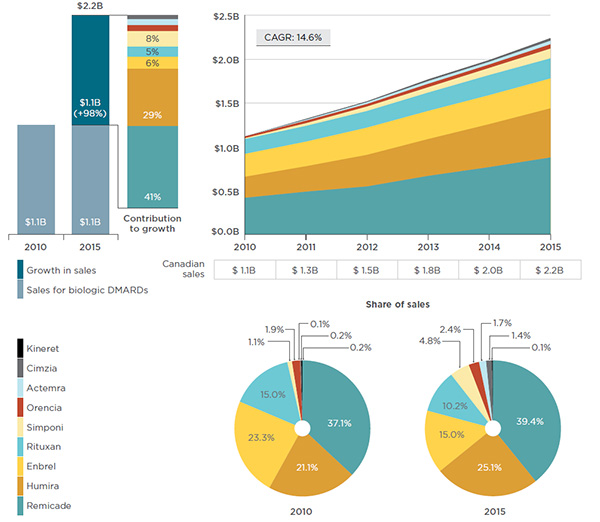
Figure description
This series of graphs illustrates the trends in Canadian sales of biologic DMARDs, by drug product from 2010 to 2015.
Two bar graphs on the left depict the growth in sales for biologic DMARDs from $1.1 billion in 2010 to $2.2 billion in 2015. The contribution of each individual drug to this growth is as follows:
- Remicade: 41%;
- Humira: 29%;
- Enbrel: 6%;
- Rituxan: 5%;
- Simponi: 8%;
- Orencia: 3%;
- Actemra: 3%;
- Cimzia: 2%;
- Kineret: 0%.
The area graph on the right depicts the sales of each drug for each year from 2010 to 2015:
blank
| |
2010 |
2011 |
2012 |
2013 |
2014 |
2015 |
| Remicade |
$0.42B |
$0.49B |
$0.55B |
$0.67B |
$0.77B |
$0.88B |
| Humira |
$0.24B |
$0.29B |
$0.36B |
$0.42B |
$0.49B |
$0.56B |
| Enbrel |
$0.26B |
$0.28B |
$0.31B |
$0.32B |
$0.33B |
$0.34B |
| Rituxan |
$0.17B |
$0.18B |
$0.19B |
$0.21B |
$0.23B |
$0.23B |
| Simponi |
$0.01B |
$0.03B |
$0.05B |
$0.06B |
$0.08B |
$0.11B |
| Orencia |
$0.02B |
$0.03B |
$0.03B |
$0.04B |
$0.04B |
$0.05B |
| Actemra |
$0.00B |
$0.01B |
$0.02B |
$0.03B |
$0.03B |
$0.04B |
| Cimzia |
$0.00B |
$0.01B |
$0.01B |
$0.02B |
$0.02B |
$0.03B |
| Kineret |
$0.00B |
$0.00B |
$0.00B |
$0.00B |
$0.00B |
$0.00B |
The two pie graphs below give the share of sales of each drug in 2010 and 2015.
Share of sales in 2010:
- Remicade: 37.1%;
- Humira: 21.1%;
- Enbrel: 23.3%;
- Rituxan: 15.0%;
- Simponi: 1.1%;
- Orencia: 1.9%;
- Actemra: 0.1%;
- Cimzia: 0.2%;
- Kineret: 0.2%.
Share of sales in 2015:
- Remicade: 39.4%;
- Humira: 25.1%;
- Enbrel: 15.0%;
- Rituxan: 10.2%;
- Simponi: 4.8%;
- Orencia: 2.4%;
- Actemra: 1.7%;
- Cimzia: 1.4%;
- Kineret: 0.1%.
*Manufacturer price levels.
Source: MIDAS™ Database, prescription retail and hospital markets, 2010 to 2015, IMS AG. All rights reserved.
Payer Markets
In 2014, 42.0% of all prescribed drug spending in Canada was covered by public drug plans, with the remainder financed by private plans (35.8%) and out-of-pocket payers (22.2%)Footnote 4.
Given the relatively high cost of biologic DMARDs, the payer breakdown for these drugs is somewhat different. The analysis indicates that 91% of the national retail costs were directly reimbursed by public and private plans, with an almost equal split: 47% paid by public plans and 44% by private plans. The remaining 9% of the costs were paid by cash. At the provincial level there are notable variations, as reported in Figure 3.2.
The estimates of the public and private plan components for the biologic DMARD market are based on pharmacy sales data, which capture the full drug cost of these drugs, including the patient-paid deductibles and co-payments. These patient-paid amounts represent approximately 7%Footnote 5 of the public and private market components, and are paid out-of-pocket by the beneficiaries or through another plan; the precise breakdown of this contribution cannot be determined from the data.
The 9% national cash component includes the amount paid by individuals without insurance, as well as the amount paid by insured individuals that were later reimbursed by their plan after submitting a paper claim. Again the precise breakdown cannot be determined.
These two data limitations may partly offset each other. Thus, out-of-pocket payments for biologic DMARDs are expected to represent an important, albeit relatively small, percentage of the retail market.
Provinces with income-based public plans (British Columbia, Saskatchewan and Manitoba) have the largest public share of retail costs. Some of these costs represent deductibles and co-payments paid out-of-pocket by beneficiaries or through another plan. As a result, the public share may be overestimated.
Figure 3.2 Provincial market share of biologic DMARD sales by payer, 2015
Click on image for larger view
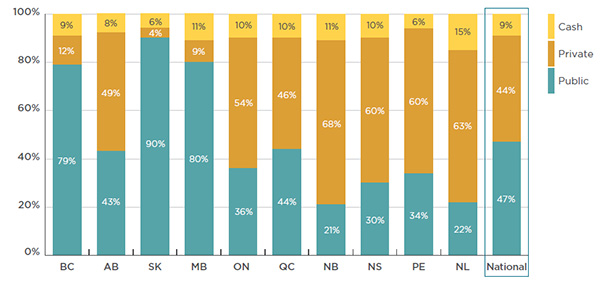
Figure description
This bar graph lists the 2015 market share of biologic DMARD sales by payer for each province in Canada as well as for the national total.
The breakdown is as follows:
blank
|
Public |
Private |
Cash |
| British Columbia |
79% |
12% |
9% |
| Alberta |
43% |
49% |
8% |
| Saskatchewan |
90% |
4% |
6% |
| Manitoba |
80% |
9% |
11% |
| Ontario |
36% |
54% |
10% |
| Quebec |
44% |
46% |
10% |
| New Brunswick |
21% |
68% |
11% |
| Nova Scotia |
30% |
60% |
10% |
| Prince Edward Island |
34% |
60% |
6% |
| Newfoundland and Labrador |
22% |
63% |
15% |
| Canadian National |
47% |
44% |
9% |
Note: Values may not add to totals due to rounding.
The public and private components include the patient-paid deductibles and co-payments. The cash component captures the amount spent by insured individuals that were later reimbursed by their drug plan after submitting a paper claim.
Source: Payer Insight Database, January–December 2015, IMS Brogan. All rights reserved.
Biologic DMARDs account for a sizable and growing share of the total drug plan costs, especially in public drug plans, where it has increased from 5.2% in 2010 to 10.1% in 2015 (Figure 3.3). These drugs account for a smaller share of the private drug plan market (5.6% in 2015), although this share has also been increasing in recent years (from 3.6% in 2010). The relatively low annual market shares for biologic DMARDs in private plans, compared to public plans, may be explained by variations in the demographic and disease profiles of the populations, but also by the use of other drugs.
Figure 3.3 Biologic DMARD market shares of total drug plan costs*
Public and private drug plans, 2010 to 2015
Click on image for larger view
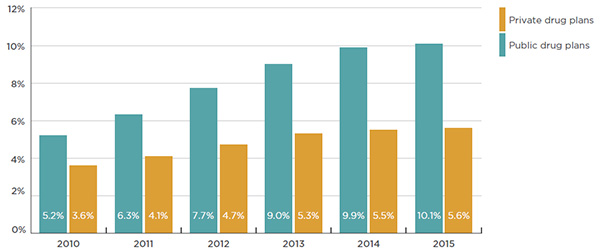
Figure description
This bar graph gives the biologic DMARD market shares of total drug plan costs for Canadian public and private plans from 2010 to 2015:
- 2010: public, 5.2%; private, 3.6%
- 2011: public, 6.3%; private, 4.1%
- 2012: public, 7.7%; private, 4.7%
- 2013: public, 9.0%; private, 5.3%
- 2014: public, 9.9%; private, 5.5%
- 2015: public, 10.1%; private, 5.6%
*Includes the drug cost in public drug plans and the drug cost and markup in private plans. Dispensing costs are excluded for both public and private drug plans.
Sources: Public drug plan data: National Prescription Drug Utilization Information System Database, Canadian Institute for Health Information, 2010 to 2015.
Private drug plan data: IMS Brogan Private Pay Direct Drug Plan Database, 2010 to 2015.
Similarly to the national market (which includes both the retail and hospital markets), the cost of biologic DMARDs in public and private drug plans (retail only) has grown markedly over the 2010 to 2015 period, with the CAGR slightly higher in public (19.3%) than in private plans (13.9%) – Figure 3.4.
The market share by drug sales for public and private drug plans demonstrates a slightly different distribution than the total national results. This is due to Rituxan, whose use as a cancer treatment is captured in hospital sales. As illustrated in Figure 3.4, the distribution of sales by drug product does not differ significantly between the public and private drug plans, indicating that there is a comparable access to biologic DMARDs.
Figure 3.4 Trends in public and private drug plan costs* for biologic DMARDs, 2010 to 2015
Click on image for larger view
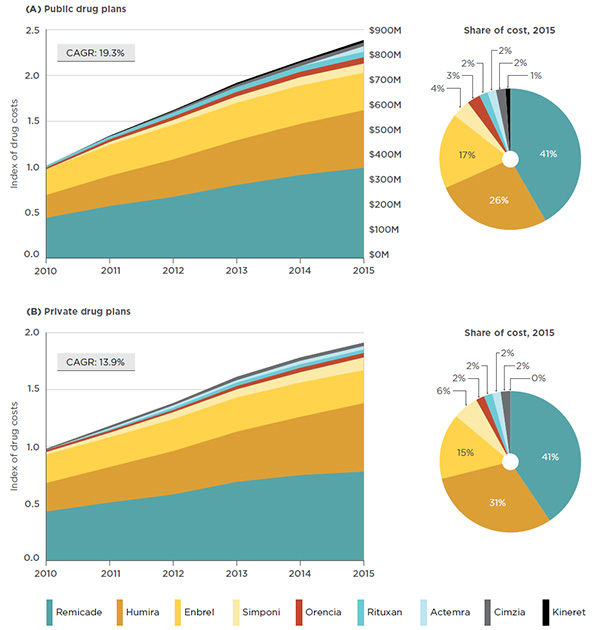
Figure description
These graphs depict the trends in public and private drug plan costs for biologic DMARDs from 2010 to 2015.
The top area graph shows growth in drug costs in public drug plans (compound annual growth rate of 19.3%) as an index, with 2010 set to a value of one. The area is further broken down into the contribution of each drug. For the public plans, the total sales for all drugs are also given for each year.
blank
|
2010 |
2011 |
2012 |
2013 |
2014 |
2015 |
| Remicade |
0.44 |
0.57 |
0.67 |
0.80 |
0.91 |
0.99 |
| Humira |
0.25 |
0.33 |
0.41 |
0.49 |
0.56 |
0.63 |
| Enbrel |
0.28 |
0.34 |
0.38 |
0.41 |
0.42 |
0.41 |
| Simponi |
0.00 |
0.03 |
0.05 |
0.07 |
0.09 |
0.10 |
| Orencia |
0.02 |
0.03 |
0.04 |
0.05 |
0.06 |
0.07 |
| Rituxan |
0.02 |
0.03 |
0.04 |
0.05 |
0.06 |
0.06 |
| Actemra |
0.00 |
0.00 |
0.00 |
0.00 |
0.00 |
0.06 |
| Cimzia |
0.00 |
0.00 |
0.02 |
0.03 |
0.04 |
0.04 |
| Kineret |
0.00 |
0.01 |
0.01 |
0.02 |
0.02 |
0.03 |
| Total |
1.00 |
1.34 |
1.63 |
1.93 |
2.17 |
2.39 |
| Actual sales |
$337.4M |
$452.5M |
$551.3M |
$650.8M |
$732.9M |
$814.2M |
The bottom area graph shows growth in drug costs in private drug plans (compound annual growth rate of 13.9%) as an index with 2010 set to a value of one. The area is further broken down into the contribution of each drug.
blank
|
2010 |
2011 |
2012 |
2013 |
2014 |
2015 |
| Remicade |
0.43 |
0.51 |
0.58 |
0.69 |
0.75 |
0.78 |
| Humira |
0.25 |
0.31 |
0.38 |
0.44 |
0.51 |
0.60 |
| Enbrel |
0.25 |
0.26 |
0.28 |
0.30 |
0.30 |
0.29 |
| Simponi |
0.02 |
0.04 |
0.06 |
0.07 |
0.09 |
0.11 |
| Orencia |
0.02 |
0.02 |
0.02 |
0.03 |
0.04 |
0.04 |
| Rituxan |
0.00 |
0.01 |
0.02 |
0.03 |
0.03 |
0.03 |
| Actemra |
0.00 |
0.01 |
0.02 |
0.02 |
0.03 |
0.03 |
| Cimzia |
0.01 |
0.02 |
0.02 |
0.03 |
0.03 |
0.03 |
| Kineret |
0.00 |
0.00 |
0.00 |
0.00 |
0.00 |
0.00 |
Two accompanying pie charts give the share of costs for each drug in public and private drug plans in 2015:
blank
|
Private drug plans |
Public drug plans |
| Remicade |
41% |
41% |
| Humira |
31% |
26% |
| Enbrel |
15% |
17% |
| Simponi |
6% |
4% |
| Orencia |
2% |
3% |
| Rituxan |
2% |
2% |
| Actemra |
2% |
2% |
| Cimzia |
2% |
2% |
| Kineret |
0% |
1% |
* Includes the drug cost in public drug plans and the drug cost and markup in private plans. Dispensing costs are excluded for both public and private drug plans.
Sources: Public drug plan data: National Prescription Drug Utilization Information System Database, Canadian Institute for Health Information, 2010 to 2015. NIHB data for 2015 was not available, so the costs were projected based on the 2010–2014 actual costs trends. Private drug plan data: IMS Brogan Private Pay Direct Drug Plan Database, 2010 to 2015.
Both public and private plans reimburse a relatively large portion of the prescription drug costs for biologic DMARDs (94% and 91%, respectively), while the remaining amounts are paid as patient deductibles or co-payments. This is greater than the average annual plan-paid share for other drugs in public (79% in 2013/14Footnote 6) and private (89% in 2015) plans.
Remicade, which is the top-selling biologic DMARD at the national level, also captures the largest share of the private and public drug plan markets (41% in both), as shown in Figure 3.4. Furthermore, within the public market segment, Remicade has the largest market share in all plans (ranging from 38% to 48%). The only exception is the NIHB public drug plan, in which Remicade and Enbrel each capture 23% of the market.
As shown in Figure 3.5, from 2010 to 2015, the growth in the cost for biologic DMARDs in public (CAGR of 19.3%) and private plans (CAGR of 13.9%) has principally been driven by an increase in the number of beneficiaries using the drugs (14.2% in public and 12.2% in private plans). While the average annual cost per beneficiary was also a factor, it was much less significant (4.2% in public and 1.5% in private plans).
Figure 3.5 Drivers of growth in the cost* of biologic DMARDs in public and private drug plans
Compound annual growth rate, 2010 to 2015
Click on image for larger view
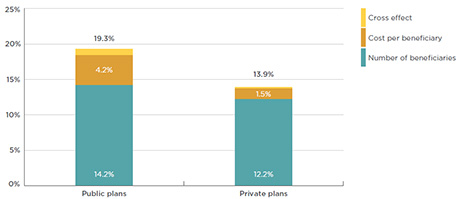
Figure description
This bar graph depicts the drivers of the growth in the cost of biologic DMARDs in public and private drug plans from 2010 to 2015
blank
| |
Public drug plans |
Private drug plans |
| Number of beneficiaries |
14.2% |
12.2% |
| Cost per beneficiary |
4.2% |
1.5% |
| Cross effect |
0.9% |
0.2% |
| Total compound annual growth rate |
19.3% |
13.9% |
Note: Values may not add to totals due to rounding.
*Includes the drug cost in public drug plans and the drug cost and markup in private plans. Dispensing costs are excluded.
Sources: Public drug plans: National Prescription Drug Utilization Information System Database, Canadian Institute for Health Information, 2010 to 2015. Private drug plans: IMS Brogan Private Pay Direct Drug Plan Database, 2010 to 2015.
An analysis of the average annual costs for biologic DMARDs highlights the variations across drug products. While the average cost for the class in public plans was $18,398 in 2015, the cost of the top-selling drug, Remicade, was 48% higher, at an average annual cost of $27,289 (Figure 3.6). The annual cost for most biologic DMARDs has increased from 2010 to 2015 (4.2% annual average), especially Remicade (5.2% annually). The increased annual cost per beneficiary can be driven by various factors including dose escalation, changes in demographics, better adherence to the therapy and price changes.
Similar findings can be seen in the private drug plan markets, although the costs are often slightly lower than in the public plans. This may be due to differences in the demographics of the population.
Figure 3.6 Annual treatment costs in public drug plans, by biologic DMARD, 2010 to 2015
Click on image for larger view
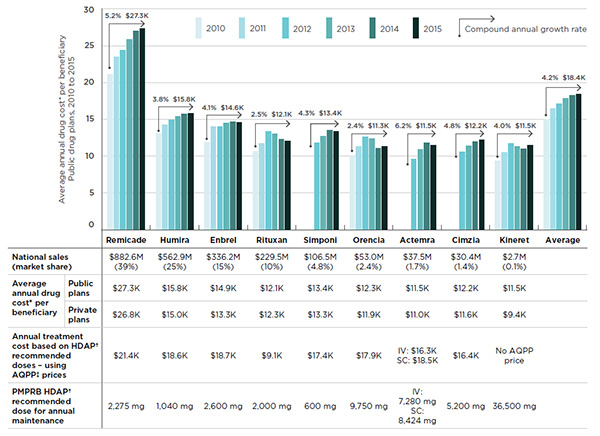
Figure description
This bar graph gives the average annual treatment cost per beneficiary (excluding markup and dispensing costs) in public drug plans from 2010 to 2015. Treatment costs are given for each biologic DMARD and for the class average.
blank
|
2010 |
2011 |
2012 |
2013 |
2014 |
2015 |
Annualized growth rate |
| Remicade |
$21.1K |
$23.5K |
$24.4K |
$25.9K |
$27.0K |
$27.3K |
5.2% |
| Humira |
$13.1K |
$14.3K |
$14.9K |
$15.4K |
$15.7K |
$15.8K |
3.8% |
| Enbrel |
$11.9K |
$14.0K |
$14.0K |
$14.5K |
$14.7K |
$14.6K |
4.1% |
| Rituxan |
$10.7K |
$11.7K |
$13.4K |
$13.0K |
$12.3K |
$12.1K |
2.5% |
| Simponi |
– |
– |
$11.8K |
$12.7K |
$13.5K |
$13.4K |
4.3% |
| Orencia |
$10.1K |
$11.3K |
$12.6K |
$12.4K |
$11.1K |
$11.3K |
2.4% |
| Actemra |
– |
– |
$9.6K |
$10.9K |
$11.8K |
$11.5K |
6.2% |
| Cimzia |
– |
– |
$10.6K |
$11.4K |
$12.0K |
$12.2K |
4.8% |
| Kineret |
$9.4K |
$10.5K |
$11.7K |
$11.3K |
$11.0K |
$11.5K |
4.0% |
| Class average |
$15.0K |
$16.5K |
$17.1K |
$17.9K |
$18.3K |
$18.4K |
4.2% |
The accompanying table below the graph gives additional information for each drug
blank
| |
Remicade |
Humira |
Enbrel |
Rituxan |
Simponi |
Orencia |
Actemra |
Cimzia |
Kineret |
| National sales |
$882.6M |
$562.9M |
$336.2M |
$229.5M |
$106.5M |
$53.0M |
$37.5M |
$30.4M |
$2.7M |
| Market share |
39% |
25% |
15% |
10% |
4.8% |
2.4% |
1.7% |
1.4% |
0.1% |
Average annual drug cost per beneficiary:
Public plans |
$27.3K |
$15.8K |
$14.9K |
$12.1K |
$13.4K |
$12.3K |
$11.5K |
$12.2K |
$11.5K |
| Average annual drug cost per beneficiary: Private plans |
$26.8K |
$15.0K |
$13.3K |
$12.3K |
$13.3K |
$11.9K |
$11.0K |
$11.6K |
$9.4K |
| Annual treatment cost based on HDAP recommended doses – using AQPP prices |
$21.4K |
$18.6K |
$18.7K |
$9.1K |
$17.4K |
$17.9K |
IV: $16.3K
SC: $18.5K |
$16.4K |
No AQPP price |
| PMPRB HDAP recommended dose for annual maintenance |
2,275 mg |
1,040 mg |
2,600 mg |
2,000 mg |
600 mg |
9,750 mg |
IV: 7,280 mg
SC: 8,424 mg |
5,200 mg |
36,500 mg |
*Includes drug cost and excludes markup and dispensing cost; the costs reported reflect the amounts what were accepted for reimbursement by the drug plans. See Appendix A for definitions.
†PMPRB Human Drug Advisory Panel.
‡Association Québécoise des pharmaciens propriétaires.
Sources: Public drug plans: National Prescription Drug Utilization Information System Database, Canadian Institute for Health Information, 2010 to 2015. Private drug plans: IMS Brogan Private Pay Direct Drug Plan Database, 2010 to 2015.
Figure 3.6 also reports the average annual cost per patient for biologic DMARDs by comparing the costs calculated using PMPRB HDAP recommended doses with the actual costs observed in the data. Note that the average annual cost per patient derived from the administrative claim-level data may underestimate the full 12-month treatment regimen, as it captures data for beneficiaries that started or ended treatment part way through the calendar year.
For most biologic DMARDs, it appears that the actual average annual cost per patient based on 2015 drug utilization data is generally less than the estimated annual treatment cost based on the PMPRB HDAP recommendation at introduction. The exceptions are Remicade and Rituxan, which have a higher actual average cost. This may be because of dose titration, which in time results in increased costs.
An analysis of the markups and dispensing costs of biologic DMARDs in public drug plans suggests that they represent a relatively low percentage of the drug costs (3.1% and 1.1%, respectively, in 2015). The average dispensing cost as a percentage of drug cost is lower in private drug plans (0.4% in 2015) than in public plans (1.1%), which may be due to dispensing fee policies or to the frequency of dispensing. Markup information is not available for private drug plans.
4. International Price Comparison
While the Canadian prices for most biologic DMARDs are either in line with, or below, international levels, two of the four top-selling products, Remicade and Rituxan, have considerably lower foreign prices. Most notably, the median list price of Remicade was 25% lower in the PMPRB7 countries than in Canada. This price difference represents $224 million in drug sales in Canada in 2015 or 1.0% of the entire Canadian pharmaceutical market.
This section reports the average foreign-to-Canadian price ratios for biologic DMARDs for a variety of bilateral and multilateral measures of foreign list prices. Bilateral price ratios compare the list price levels for an individual country to those available in Canada, while multilateral ratios compare the list prices across all countries analyzed to those available in Canada. Appendix B provides an in-depth description of how the average foreign-to-Canadian price ratios are calculated.
Note that the list prices reported may vary across countries depending on whether the drugs are procured through the retail or hospital sectors. List prices may also vary across countries depending on the delivery channels. In the case of Remicade, for instance, infusions in Canada are almost exclusively delivered in manufacturer-sponsored infusion centers, while in other countries the infusions are generally delivered in hospitals.
Figure 4.1 reports the bilateral foreign-to-Canadian price ratios for each of the PMPRB7 countries at the drug class level in 2015, along with the multilateral median foreign-to-Canadian price ratios for the PMPRB7 and the OECD countries.
The results are expressed as an index with the Canadian price for 2015 set to a value of one, and the international measures reported relative to this value. The median PMPRB7-to-Canadian price ratio was 0.89, suggesting that the median prices for biologic DMARDs in the PMPRB7 markets were, on average, 11% lower than in Canada. Similarly, the median OECD-to-Canadian price ratio was 0.78, indicating that the median prices in the OECD markets were, on average, 22% lower than in Canada. The bilateral results show that prices in four European markets are considerably below the Canadian level (France, Italy, Sweden and the UK).
Figure 4.1 Average foreign-to-Canadian price ratios for biologic DMARDs
Canada versus PMPRB7* and OECD countries, 2015
Click on image for larger view
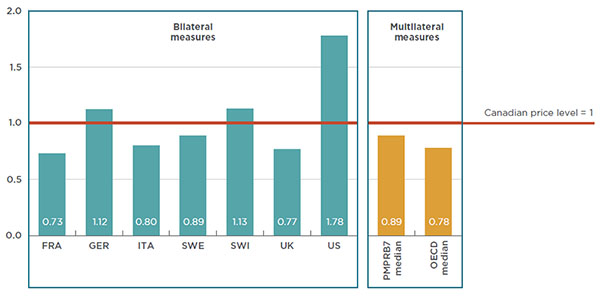
Figure description
This bar graph gives the 2015 bilateral foreign-to-Canadian price ratios for biologic DMARDs for each of the PMPRB7 countries, as well as the multilateral foreign-to-Canadian price ratios for the PMPRB7 and Organisation for Economic Co-operation and Development median prices. Foreign prices are compared to the Canadian price level, which is set to one.
France: 0.73; Germany: 1.12; Italy: 0.80; Sweden: 0.89; Switzerland: 1.13; United Kingdom: 0.77; United States: 1.78; PMPRB7 median: 0.89; Organisation for Economic Co-operation and Development median: 0.78.
*France, Germany, Italy, Sweden, Switzerland, the United Kingdom and the United States.
Source: MIDAS™ Database, January–December 2015, IMS AG. All rights reserved.
These overall results mask important price differences at the drug level. While the Canadian prices of several biologic DMARDs are in line with international price levels, foreign markets have, on average, significantly lower prices for two of the four top-selling products: Remicade and Rituxan.
Figure 4.2 reports the differences between foreign and Canadian list prices for the most common strength of each drug. The results are presented in the form of an index, with the Canadian price set to a value of one, and the international measures reported relative to this value. The price ranges for the six European countries in the PMPRB7 are represented by rectangular boxes. The median PMPRB7 price, the median OECD price, and the average US price are also reported.
For instance, the median PMPRB7-to-Canadian price ratio for Remicade was 0.75 in 2015, suggesting that median prices in the PMPRB7 markets were, on average, 25% lower than in Canada. Similarly, the results indicate that the US price was 11% lower, and the median price in the OECD countries was 35% lower. Thus, all measures of foreign price analyzed indicate that Canada has the highest price for Remicade.
The median PMPRB7-to-Canadian price ratio for Rituxan was 0.84 in 2015, suggesting that median prices in the PMPRB7 markets were, on average, 16% lower than in Canada.
Figure 4.2 Foreign-to-Canadian price ratios by biologic DMARD
Canada versus PMPRB7* and OECD countries, 2015
Click on image for larger view
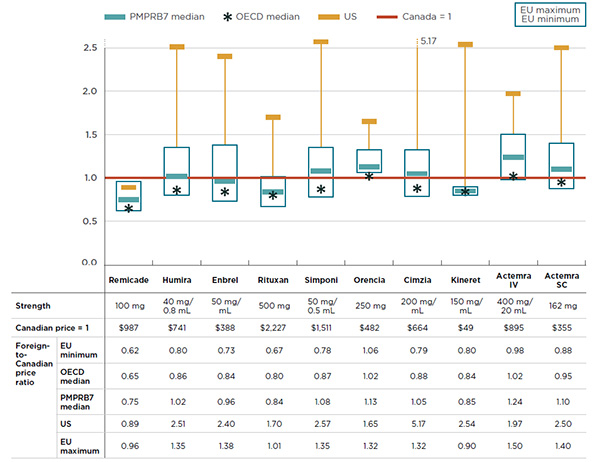
Figure description
This graph gives the 2015 foreign-to-Canadian price ratios by biologic DMARD for the PMPRB7 and Organisation for Economic Co-operation and Development countries. The Canadian price (which is given in the table below the graph) is set to one and the international measures reported relative to this value. On the graph, the price ranges for the six European countries in the PMPRB7 are represented by rectangular boxes. The median PMPRB7 price, the median Organisation for Economic Co-operation and Development price, and the average United States price are also reported.
blank
| |
Remicade |
Humira |
Enbrel |
Rituxan |
Simponi |
Orencia |
Cimzia |
Kineret |
Actemra IV |
Actemra SC |
| Strength |
100 mg |
40 mg/0.8 mL |
50 mg/mL |
500 mg |
50 mg/0.5 mL |
250 mg |
200 mg/mL |
150 mg/mL |
400 mg/20 mL |
162 mg |
| Canadian price (= 1) |
$987 |
$741 |
$388 |
$2,227 |
$1,511 |
$482 |
$664 |
$49 |
$895 |
$355 |
| European minimum foreign-to-Canadian price ratio |
0.62 |
0.80 |
0.73 |
0.67 |
0.78 |
1.06 |
0.79 |
0.80 |
0.98 |
0.88 |
| Organisation for Economic Co-operation and Development median foreign-to-Canadian price ratio |
0.65 |
0.86 |
0.84 |
0.80 |
0.87 |
1.02 |
0.88 |
0.84 |
1.02 |
0.95 |
| PMPRB7 median foreign-to-Canadian price ratio |
0.75 |
1.02 |
0.96 |
0.84 |
1.08 |
1.13 |
1.05 |
0.85 |
1.24 |
1.10 |
| United States-to-Canadian price ratio |
0.89 |
2.51 |
2.40 |
1.70 |
2.57 |
1.65 |
5.17 |
2.54 |
1.97 |
2.50 |
| European maximum foreign-to-Canadian price ratio |
0.96 |
1.35 |
1.38 |
1.01 |
1.35 |
1.32 |
1.32 |
0.90 |
1.50 |
1.40 |
*France, Germany, Italy, Sweden, Switzerland, the United Kingdom and the United States.
Source: MIDAS™ Database, January–December 2015, IMS AG. All rights reserved.
The full treatment cost for biologic DMARDs is not just a function of price but also of the treatment regimen. Figure 4.3 combines the two elements in a comparison of the average annual treatment costs across countries for 2015.
Treatment costs were based on HDAP estimated annual maintenance doses and IMS MIDAS™ international prices for all sizes and strengths of each drug. Note that the average treatment costs for some drugs may be underestimated, as the costs based on HDAP maintenance doses may be lower than the actual costs observed in the public plan data.
In Figure 4.3, the ranges in treatment costs for the six European countries in the PMPRB7 are represented by rectangular boxes. The average Canadian treatment cost, the median PMPRB7 cost, the median OECD cost and the average US treatment cost are also provided. As in the previous section, the results (based on list prices) indicate that Remicade had the highest estimated treatment cost in Canada compared to other countries and compared to other biologic DMARDs sold in Canada. If Canadians had paid the median list price of the PMPRB7 countries, based on the recommended doses, the average treatment cost for Remicade in Canada would have been $16.7K instead of $22.5K in 2015.
Given its treatment regimen, Rituxan has the lowest average annual treatment cost of the biologic DMARDs in Canada. Nonetheless, foreign markets have even lower prices. If Canadians had paid the median list price of the PMPRB7 countries, based on the recommended doses, the average treatment cost for Rituxan would have been $7.3K instead of $8.9K in 2015.
Figure 4.3 Annual treatment costs for biologic DMARDs
Canada versus PMPRB7* and OECD countries, 2015
Click on image for larger view
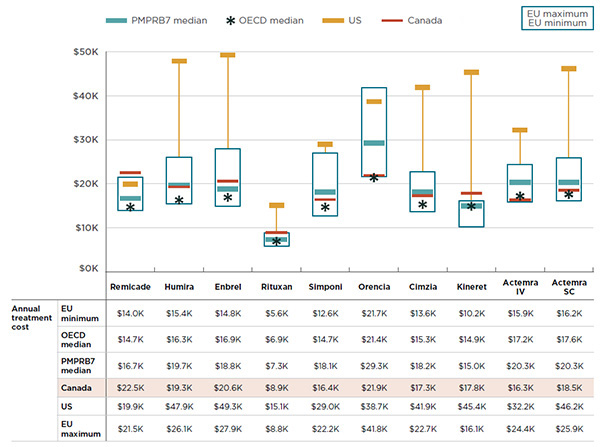
Figure description
This graph gives the 2015 annual treatment costs for biologic DMARDs for Canada, as well as the PMPRB7 and Organisation for Economic Co-operation and Development countries. The ranges in treatment costs for the six European countries in the PMPRB7 are represented by rectangular boxes. The average Canadian treatment cost, the median PMPRB7 cost, the median Organisation for Economic Co-operation and Development cost and the average United States treatment cost are also provided.
blank
| |
Remicade |
Humira |
Enbrel |
Rituxan |
Simponi |
Orencia |
Cimzia |
Kineret |
Actemra IV |
Actemra SC |
| European minimum annual treatment cost |
$14.0K |
$15.4K |
$14.8K |
$5.6K |
$12.6K |
$21.7K |
$13.6K |
$10.2K |
$15.9K |
$16.2K |
| Organisation for Economic Co-operation and Development median annual treatment cost |
$14.7K |
$16.3K |
$16.9K |
$6.9K |
$14.7K |
$21.4K |
$15.3K |
$14.9K |
$17.2K |
$17.6K |
| PMPRB7 median annual treatment cost |
$16.7K |
$19.7K |
$18.8K |
$7.3K |
$18.1K |
$29.3K |
$18.2K |
$15.0K |
$20.3K |
$20.3K |
| Canadian annual treatment cost |
$22.5K |
$19.3K |
$20.6K |
$8.9K |
$16.4K |
$21.9K |
$17.3K |
$17.8K |
$16.3K |
$18.5K |
| United States annual treatment cost |
$19.9K |
$47.9K |
$49.3K |
$15.1K |
$29.0K |
$38.7K |
$41.9K |
$45.4K |
$32.2K |
$46.2K |
| European maximum annual treatment cost |
$21.5K |
$26.1K |
$27.9K |
$8.8K |
$22.2K |
$41.8K |
$22.7K |
$16.1K |
$24.4K |
$25.9K |
Note: All prices are from IMS MIDAS™ data except for Actemra SC, which is based on l'Association québécoise des pharmaciens propriétaires (AQPP) prices. Annual doses are based on PMPRB Human Drug Advisory Panel (HDAP) recommendations.
*France, Germany, Italy, Sweden, Switzerland, the United Kingdom and the United States.
Sources: MIDAS™ Database, January–December 2015, IMS AG. All rights reserved.
PMPRB Human Drug Advisory Panel reviews.
The results demonstrate a pattern similar to Figure 4.2. One point clearly emerges: not only is the list price of Remicade in Canada higher than in foreign markets, but the average annual treatment cost in Canada is greater than the median international costs of the alternative treatment options.
An analysis of the international rates of consumption of biologic DMARDs suggests that Canada uses more of the higher-cost treatment options. Figure 4.4 compares the foreign and Canadian consumption rates for biologic DMARDs based on the annual maintenance dose determined by the PMPRB HDAP and reported per one million inhabitants per year.
The results suggest that the equivalent of 1,094 patients out of one million Canadians received a full annual treatment of Remicade, and another 1,018 patients received a full annual treatment of Humira. The Canadian rate of consumption of the two top-selling drugs is double that of other countries, with the PMPRB7 median consumption rates for Remicade and Humira being 495 and 598 annual doses per one million inhabitants, respectively. Canada also has a markedly higher consumption rate for Enbrel (455) than the PMPRB7 median (356). These three biologic DMARDs have some of the highest treatment costs in CanadaFootnote 7.
Figure 4.4 Rate of consumption* of biologic DMARDs
Canada versus PMPRB7† and OECD countries, 2015
Click on image for larger view
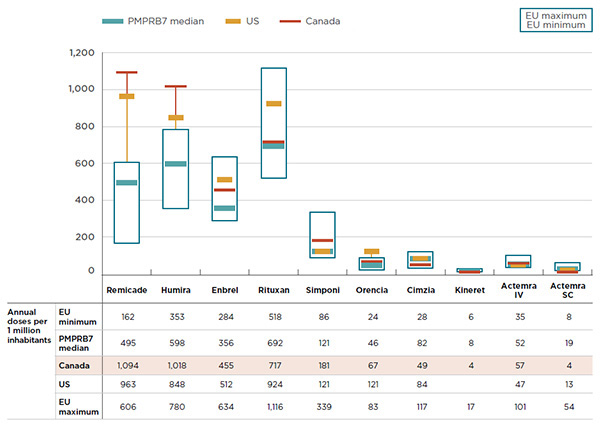
Figure description
This graph compares the 2015 Canadian consumption rates for biologic DMARDs to the rates in the PMPRB7 countries. The ranges in consumption rates for the six European countries in the PMPRB7 are represented by rectangular boxes. The average Canadian, average United States and median PMPRB7 consumption rates are also given. Consumption rates are measured as the number of annual doses per one million inhabitants.
blank
| |
Remicade |
Humira |
Enbrel |
Rituxan |
Simponi |
Orencia |
Cimzia |
Kineret |
Actemra IV |
Actemra SC |
| European minimum |
162 |
353 |
284 |
518 |
86 |
24 |
28 |
6 |
35 |
8 |
| PMPRB7 median |
495 |
598 |
356 |
692 |
121 |
46 |
82 |
8 |
52 |
19 |
| Canada |
1,094 |
1,018 |
455 |
717 |
181 |
67 |
49 |
4 |
57 |
4 |
| United States |
963 |
848 |
512 |
924 |
121 |
121 |
84 |
|
47 |
13 |
| European maximum |
606 |
780 |
634 |
1,116 |
339 |
83 |
117 |
17 |
101 |
54 |
*Based on the annual maintenance dose determined by the PMPRB Human Drug Advisory Panel and reported per one million inhabitants per year.
†France, Germany, Italy, Sweden, Switzerland, the United Kingdom and the United States.
Source: MIDAS™ Database, January–December 2015, IMS AG. All rights reserved.
Table 4.1 explores the cost implications of higher list prices for Remicade in Canadian national and public drug plan markets compared to the median PMPRB7 levels. The 25% price differential between foreign and Canadian list pricesFootnote 8 for Remicade reported in Figure 4.2 translates into $224 million in drug sales in Canada in 2015 or 1.0% of the entire Canadian pharmaceutical market for that year. Using the same comparison, the difference represents $86 million for the public drug plans in 2015 or 1.2% of their overall costs.
Table 4.1 Estimated sales and cost implications of higher list prices for Remicade in Canada compared to the median PMPRB7* price level in 2015
| |
Canadian national market (all payers) |
Public drug plans |
| BC |
AB |
SK |
MB |
ON |
NB |
NS |
PE |
NL |
NIHB |
Total† |
Remicade
drug sales/cost |
$883M |
$84M |
$62M |
$31M |
$33M |
$101M |
$6M |
$10M |
$2M |
$4M |
$6M |
$339M |
Estimated
sales/costs at 25% lower PMPRB7 median price |
Absolute amounts |
$224M |
$21M |
$16M |
$8M |
$8M |
$26M |
$2M |
$3M |
$1M |
$1M |
$2M |
$86M |
Share of the
pharmaceutical
market |
1.0% |
1.7% |
2.3% |
2.0% |
1.8% |
0.7% |
1.0% |
1.6% |
2.1% |
1.0% |
0.5% |
1.2% |
|
Note: In Canada, Remicade infusions are almost exclusively delivered in manufacturer-sponsored infusion centers, while in other countries the infusions are generally delivered in hospitals.
*France, Germany, Italy, Sweden, Switzerland, the United Kingdom and the United States.
†Total results for the public drug plans reported in this table.
Sources: Canadian national market: MIDAS™ Database, January–December 2015, IMS AG. All rights reserved.
Provincial public drug plans: National Prescription Drug Utilization Information System Database, Canadian Institute for Health Information, January–December 2015.
|
A closer look at the recent trends shows a noticeable divergence in price between the Canadian and foreign markets over time. While Canadian prices have been slowly increasing at a rate lower than the rate of inflation, prices in the PMPRB7 countries (except in the US market) have been flat or declining (see Figure 4.5). This has resulted in a growing gap between Canadian and foreign prices.
Figure 4.5 Trends in prices for biologic DMARDs
Canada versus PMPRB7*, 2011 to 2015
Click on image for larger view
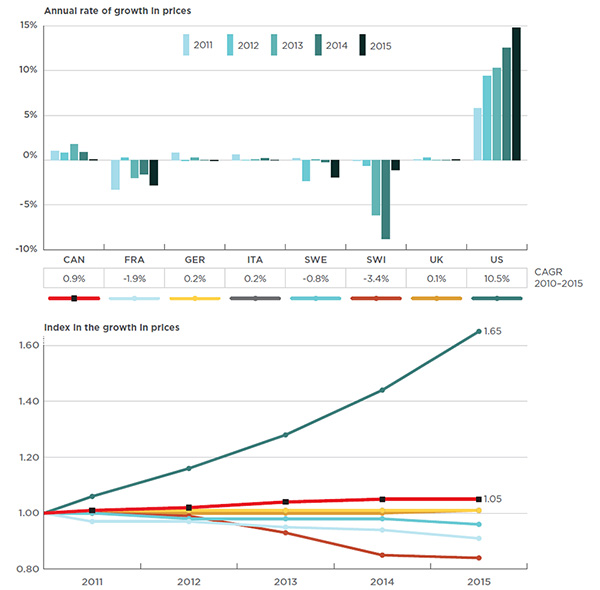
Figure description
These two graphs give the trends in prices for biologic DMARDs in Canada and the PMPRB7 countries from 2011 to 2015.
The first graph is a bar graph depicting the annual growth rate in price for each country.
blank
| |
2011 |
2012 |
2013 |
2014 |
2015 |
Compound annual growth rate 2010–2015 |
| Canada |
1.0% |
0.8% |
1.8% |
0.9% |
0.1% |
0.9% |
| France |
-3.3% |
0.3% |
-2.0% |
-1.6% |
-2.8% |
-1.9% |
| Germany |
0.8% |
-0.1% |
0.3% |
0.0% |
-0.1% |
0.2% |
| Italy |
0.6% |
0.0% |
0.1% |
0.2% |
0.0% |
0.2% |
| Sweden |
0.2% |
-2.3% |
0.1% |
-0.2% |
-1.9% |
-0.8% |
| Switzerland |
-0.1% |
-0.6% |
-6.1% |
-8.8% |
-1.1% |
-3.4% |
| United Kingdom |
0.1% |
0.3% |
0.0% |
0.0% |
0.1% |
0.1% |
| United States |
5.8% |
9.4% |
10.3% |
12.5% |
14.8% |
10.5% |
The second line graph gives the corresponding indexed annual growth in price with the 2010 price for each country set to one.
blank
| |
2010 |
2011 |
2012 |
2013 |
2014 |
2015 |
| Canada |
1.00 |
1.01 |
1.02 |
1.04 |
1.05 |
1.05 |
| France |
1.00 |
0.97 |
0.97 |
0.95 |
0.94 |
0.91 |
| Germany |
1.00 |
1.01 |
1.01 |
1.01 |
1.01 |
1.01 |
| Italy |
1.00 |
1.01 |
1.01 |
1.01 |
1.01 |
1.01 |
| Sweden |
1.00 |
1.00 |
0.98 |
0.98 |
0.98 |
0.96 |
| Switzerland |
1.00 |
1.00 |
0.99 |
0.93 |
0.85 |
0.84 |
| United Kingdom |
1.00 |
1.00 |
1.00 |
1.00 |
1.00 |
1.01 |
| United States |
1.00 |
1.06 |
1.16 |
1.28 |
1.44 |
1.65 |
*France, Germany, Italy, Sweden, Switzerland, the United Kingdom and the United States.
Source: MIDAS™ Database, 2011 to 2015, IMS AG. All rights reserved.
For example, from 2010 to 2015, the price of biologic DMARDs in Canada increased by 5%. Canada was the only country with a price growth other than the US, which had an unparalleled 65% price increase. By contrast, several countries, including Switzerland, France and Sweden, had marked price reductions over the same time period.
5. Manufacturer-Level Analysis
Canada accounts for a sizable share of the international sales of biologic DMARDs, making it an important market from the standpoint of the manufacturers operating in this space. For several of these manufacturers, biologic DMARDs account for the bulk of their drug portfolios and represent a key driver of their sales growth in Canada.
Several manufacturers draw important revenues from the public payer market. For instance, the entire portfolio of products from Janssen Inc., the manufacturer of Remicade, represents 6.0% to 12.3% of the total public plan drug costs.
While Canada accounts for 2.5% of the total OECD pharmaceutical market, it represents an even larger share of the OECD market for biologic DMARDs at 4.0%, with Janssen Inc.’s sales of Remicade in Canada accounting for 8.5% of all OECD sales (see Table 5.1).
Table 5.1 Canada’s share of the OECD market for biologic DMARDs, 2015
| Biologic DMARD (manufacturer) |
Sales in Canada |
Canadian share of OECD sales |
| Remicade (Janssen) |
$882.6M |
8.5% |
| Humira (AbbVie) |
$562.9M |
3.0% |
| Enbrel (Amgen) |
$336.2M |
2.9% |
| Rituxan (Roche) |
$229.5M |
3.2% |
| Simponi (Janssen) |
$106.5M |
4.5% |
| Orencia (BMS Canada) |
$53.0M |
2.3% |
| Actemra (Roche) |
$37.5M |
2.3% |
| Cimzia (UCB Canada) |
$30.4M |
1.8% |
| Kineret (Sobi) |
$2.7M |
3.1% |
| All biologic DMARDs |
$ 2,241.3M |
4.0% |
| All pharmaceuticals |
2.5% |
Note: For manufacturer-level data, efforts were made to identify and include all subsidiaries, but due to a lack of clarity in some ownership structures it is possible that some revenues have been omitted.
Source: MIDAS™ Database, January–December 2015, IMS AG. All rights reserved. |
Biologic DMARDs are the top-selling products for six of the seven manufacturers operating in this space: Janssen Inc.; AbbVie; Amgen Canada Inc.; Hoffmann-La Roche Limited; UCB Canada Inc.; and Swedish Orphan Biovitrum AB, Sobi. As Figure 5.1 suggests, biologic DMARDs account for an important share of their Canadian portfolio.
Figure 5.1 Biologic DMARDs share of manufacturer’s basket of drugs, Canada, 2015
Click on image for larger view
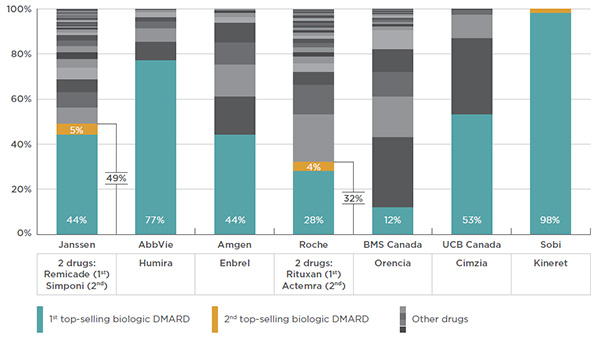
Figure description
This bar graph gives the biologic DMARDs share of each manufacturer’s basket of drugs in Canada in 2015. The biologic DMARDs are indicated by coloured portions of each bar; all other drugs appear as black and grey areas.
blank
| Manufacturer |
Biologic DMARDs |
| Janssen |
Remicade (44%); Simponi (5%) |
| AbbVie |
Humira (77%) |
| Amgen |
Enbrel (44%) |
| Roche |
Rituxan (28%); Actemra (4%) |
| BMS Canada |
Orencia (12%) |
| UCB Canada |
Cimzia (53%) |
| Sobi |
Kineret (98%) |
Source: MIDAS™ Database, January–December 2015, IMS AG. All rights reserved.
In public drug plans, the biologic DMARD share of the manufacturers’ sales is even more concentrated than in the national market (Table 5.2), and has fueled the increase in public plan costs related to the manufacturers’ portfolios.
Table 5.2 Manufacturers of biologic DMARDs
Public drug plans in Canada, 2010 and 2014
| Manufacturer |
Biologic DMARDs |
Manufacturer’s portfolio of drugs |
| Drugs available in 2015 |
Cost (millions) |
Growth (%) |
No. of products |
Cost (millions) |
Growth (%) |
Biologic DMARDs share of basket |
| 2010 |
2015 |
2010/15 |
2010 |
2015 |
2010 |
2015 |
2010/15 |
2010 |
2015 |
| Janssen |
Remicade; Simponi |
$149.0 |
$373.4 |
151% |
31 |
37 |
$300.6 |
$650.0 |
116% |
50% |
57% (↑) |
| AbbVie |
Humira |
$85.4 |
$219.5 |
157% |
6 |
9 |
$110.2 |
$257.5 |
134% |
77% |
85% (↑) |
| Amgen |
Enbrel |
$98.2 |
$148.4 |
51% |
5 |
8 |
$131.8 |
$247.6 |
88% |
75% |
60% (↓) |
| Roche |
Actemra; Rituxan |
$6.9 |
$37.2 |
437% |
26 |
29 |
$70.0 |
$73.8 |
5% |
10% |
50% (↑) |
| BMS Canada |
Orencia |
$6.6 |
$25.5 |
287% |
28 |
23 |
$36.4 |
$133.0 |
266% |
18% |
19% (↑) |
| UCB Canada |
Cimzia |
– |
$9.4 |
NA |
1 |
3 |
$0.7 |
$18.3 |
NA |
0% |
51% (↑) |
| Sobi |
Kineret |
$0.7 |
$0.6 |
-9% |
1 |
1 |
$0.7 |
$0.6 |
-9% |
100% |
100% (-) |
| Source: National Prescription Drug Utilization Information System Database, Canadian Institute for Health Information, 2010 to 2015. |
For these manufacturers, most of the sales in the public drug plan markets are focused on the antineoplastic and immunomodulating agents therapeutic class (ATC level 1)—except for Bristol-Myers Squibb Canada Co., which has the largest share of its sales in nervous system drugs. Appendix C provides a detailed distribution of each manufacturer’s basket of molecules by therapeutic class for the public drug plans.
The manufacturers of biologic DMARDs draw important revenues from the public payer market. For instance, several provinces spent around one tenth of their budget on Janssen Inc.’s drugs in 2015 (Figure 5.2).
Figure 5.2 Share of public drug plan costs by manufacturer, 2015
Click on image for larger view
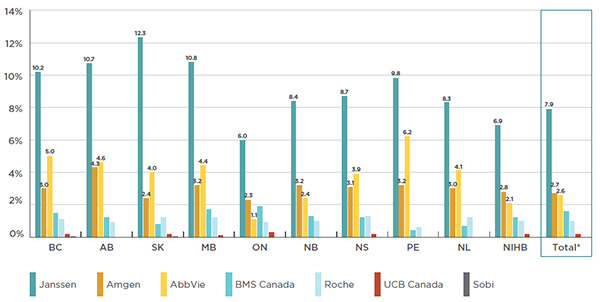
Figure description
This bar graph gives the share of 2015 Canadian public drug plan costs by the manufacturers of biologic DMARDs.
blank
|
Janssen |
Amgen |
AbbVie |
BMS Canada |
Roche |
UCB Canada |
Sobi |
| British Columbia |
10.2% |
3.0% |
5.0% |
1.5% |
1.1% |
0.2% |
0.023% |
| Alberta |
10.7% |
4.3% |
4.6% |
1.2% |
0.9% |
0.0% |
0.000% |
| Saskatchewan |
12.3% |
2.4% |
4.0% |
0.8% |
1.2% |
0.2% |
0.023% |
| Manitoba |
10.8% |
3.2% |
4.4% |
1.7% |
1.2% |
0.1% |
0.000% |
| Ontario |
6.0% |
2.3% |
1.1% |
1.9% |
0.9% |
0.3% |
0.004% |
| New Brunswick |
8.4% |
3.2% |
2.4% |
1.3% |
1.0% |
0.0% |
0.000% |
| Nova Scotia |
8.7% |
3.1% |
3.9% |
1.2% |
1.3% |
0.2% |
0.000% |
| Prince Edward Island |
9.8% |
3.2% |
6.2% |
0.4% |
0.6% |
0.0% |
0.000% |
| Newfoundland and Labrador |
8.3% |
3.0% |
4.1% |
0.7% |
1.2% |
0.0% |
0.000% |
| Non-Insured Health Benefits |
6.9% |
2.8% |
2.1% |
1.2% |
1.0% |
0.2% |
0.000% |
| Total |
7.9% |
2.7% |
2.6% |
1.6% |
1.0% |
0.2% |
0.007% |
*Total results for the public drug plans reported in this figure.
Source: National Prescription Drug Utilization Information System Database, Canadian Institute for Health Information, January–December 2015.
6. Biosimilars: Availability and Pricing
Remicade (infliximab) was the first biologic DMARD with biosimilar sales in Canada. Although the biosimilars for infliximab were first available for sale in Canada and the PMPRB7 countries in 2015, other OECD countries recorded sales as early as 2012.
While the price of the biosimilar for infliximab in Canada is in line with the median price level for the OECD countries, the uptake in sales has been modest.
There were two biosimilars for Remicade (infliximab) on the international market as of December 2015 – Inflectra and Remsima – and their availability and sales varied by country (see Table 6.1). Although both drugs were approved for sale in Canada, 2015 sales data is only available for Inflectra.
While there has been a substantial uptake in the biosimilars for infliximab in many OECD countries, including the PMPRB7, the uptake in Canada has been low (0.2% based on private drug plan data). By comparison, the median biosimilar uptake in the OECD countries was 10.1% of the infliximab use in 2015, with 12 countries out of 24 having double-digit capture rates (highlighted in Table 6.1). Norway and Poland had the greatest biosimilar market capture at 67.8% and 78.1%, respectively.
Table 6.1 also compares the international prices of Remicade and the infliximab biosimilars, along with their price differences by country. In 2015, the list price of the infliximab biosimilar in Canada was $525, representing 53% of the Canadian price for Remicade. Although this was one of the largest price differences between the biosimilar and the reference product among the OECD countries, the price of the biosimilar in Canada was actually slightly above the OECD median ($515). The large percent difference results from the list price of Remicade in Canada ($987), which was the highest among the markets analyzed.
Following the biosimilar entry, the price of Remicade dropped, on average, by 6% in the OECD countries, while in Canada it remained virtually unchanged.
The results indicate that not only have countries such as Norway achieved incredibly low prices for the infliximab biosimilars ($173), but the uptake of these drugs has ensured a sizable market capture in 2015 (67.8%).
Table 6.1 Pricing and availability of the biosimilars for infliximab
Canada versus PMPRB7* and other OECD countries, 2015
| Country |
Biosimilar |
First year with available biosimilar sales |
Biosimilar's share of units |
Remicade price |
Biosimilar price |
| Year prior to biosimilar entry |
2015 |
% change |
2015 |
% of Remicade price |
| Canada |
Inflectra |
2015 |
0.2%† |
$988 |
$987 |
0% |
$525** |
53% |
| PMPRB7 |
France |
Inflectra, Remsima |
2015 |
4.3% |
$696 |
$616 |
-12% |
$616 |
88% |
| Germany |
Inflectra |
2015 |
10.1% |
$937 |
$877 |
-6% |
$810 |
86% |
| Italy |
Inflectra, Remsima |
2015 |
12.0% |
$651 |
$628 |
-3% |
$548 |
84% |
| Sweden |
Inflectra, Remsima |
2015 |
9.0% |
$845 |
$736 |
-13% |
$465 |
55% |
| Switzerland‡ |
NA |
NA |
NA |
- |
$947 |
- |
- |
- |
| United Kingdom |
Inflectra, Remsima |
2015 |
10.1% |
$686 |
$717 |
5% |
$646 |
94% |
| United States |
Inflectra, Remsima |
2016§ |
NA |
$715 |
$875 |
22% |
- |
- |
| Other OECD countries |
Australia |
Inflectra |
2015 |
0.2% |
$740 |
$693 |
-6% |
$427 |
58% |
| Austria |
Inflectra, Remsima |
2015 |
2.8% |
$821 |
$795 |
-3% |
$560 |
68% |
| Belgium |
Inflectra, Remsima |
2015 |
0.6% |
$769 |
$645 |
-16% |
$552 |
72% |
| Chile |
Remsima |
2014 |
1.6% |
$722 |
$643 |
-11% |
$517 |
72% |
| Czech Republic |
Inflectra, Remsima |
2013 |
20.6% |
$622 |
$529 |
-15% |
$514 |
83% |
| Finland |
Inflectra, Remsima |
2013 |
32.5% |
$772 |
$852 |
10% |
$598 |
77% |
| Hungary |
Inflectra |
2014 |
24.6% |
$641 |
$637 |
-1% |
$446 |
70% |
| Ireland |
Inflectra, Remsima |
2014 |
3.9% |
$803 |
$832 |
4% |
$633 |
79% |
| Japan |
Inflectra |
2014 |
1.1% |
$864 |
$768 |
-11% |
$513 |
59% |
| Korea |
Remsima |
2012 |
26.0% |
$451 |
$369 |
-18% |
$350 |
78% |
| Norway |
Inflectra, Remsima |
2013 |
67.8% |
$661 |
$558 |
-16% |
$173 |
26% |
| Poland |
Inflectra, Remsima |
2014 |
78.1% |
$607 |
$457 |
-25% |
$368 |
61% |
| Portugal |
Inflectra, Remsima |
2013 |
15.1% |
$600 |
$514 |
-14% |
$415 |
69% |
| Slovakia |
Inflectra, Remsima |
2014 |
8.5% |
$648 |
$648 |
0% |
$470 |
73% |
| Spain |
Inflectra, Remsima |
2015 |
12.8% |
$787 |
$761 |
-3% |
$624 |
79% |
| Turkey |
Remsima |
2014 |
10.7% |
$285 |
$231 |
-19% |
$222 |
78% |
| OECD median |
10.1% |
$715 |
$671 |
-6% |
$515 |
72% |
Note: OECD countries not reported in the table have no sales information available for 2015.
*France, Germany, Italy, Sweden, Switzerland, the United Kingdom and the United States.
†Estimated based on data from the IMS Brogan Private Pay Direct Drug Plan Database.
‡No sales for Inflectra were available for Switzerland in 2015.
§US FDA approval.
**Ontario Drug Benefit formulary.
Source: MIDAS™ Database, January–December 2015, IMS AG. All rights reserved. |
Figure 6.1 provides a graphical representation of price differentials between Remicade and its biosimilars in Canadian and foreign markets based on 2015 list prices. The results are presented as an index, with the Canadian price for Remicade ($987) set to the value of one, and the international prices of this product and associated biosimilars determined relative to this value.
While Canada has the highest price for Remicade amongst the OECD countries (with available data), the price of its biosimilar ($525) is generally lower than the available price levels in the PMPRB7 countries, and in line with the median OECD price level of $515 (as reported in Table 6.1).
Figure 6.1 Pricing of biosimilars for Remicade
Canada versus PMPRB7* and other OECD† countries, 2015
Click on image for larger view
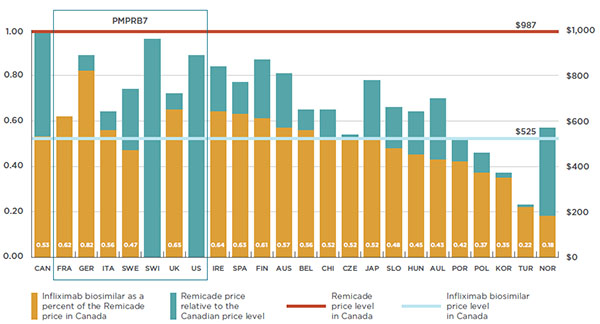
Figure description
This bar graph illustrates the pricing of the biosimilar for Remicade in Canada versus the PMPRB7 and select Organisation for Economic Co-operation and Development countries in 2015. The Remicade price level in Canada – $978 – is given as one. The biosimilar price in Canada is $525.
blank
|
Infliximab biosimilar as a percent of the Remicade price in Canada |
Remicade price above the price of the infliximab biosimilar |
| Canada |
0.53 |
0.47 |
| France |
0.62 |
0.00 |
| Germany |
0.82 |
0.07 |
| Italy |
0.56 |
0.08 |
| Sweden |
0.47 |
0.27 |
| Switzerland |
– |
0.96 |
| United Kingdom |
0.65 |
0.07 |
| United States |
– |
0.89 |
| Ireland |
0.64 |
0.20 |
| Spain |
0.63 |
0.14 |
| Finland |
0.61 |
0.26 |
| Austria |
0.57 |
0.24 |
| Belgium |
0.56 |
0.09 |
| Chili |
0.52 |
0.13 |
| Czech Republic |
0.52 |
0.02 |
| Japan |
0.52 |
0.26 |
| Slovakia |
0.48 |
0.18 |
| Hungry |
0.45 |
0.19 |
| Australia |
0.43 |
0.27 |
| Portugal |
0.42 |
0.10 |
| Poland |
0.37 |
0.09 |
| South Korea |
0.35 |
0.02 |
| Turkey |
0.22 |
0.01 |
| Norway |
0.18 |
0.39 |
*France, Germany, Italy, Sweden, Switzerland, the United Kingdom and the United States.
†Ireland, Spain, Finland, Austria, Belgium, Chili, the Czech Republic, Japan, Slovakia, Hungry, Australia, Portugal, Poland, South Korea, Turkey and Norway.
Source: MIDAS™ Database, January–December 2015, IMS AG. All rights reserved.
Despite the markedly lower price, the biosimilar market uptake has been modest in its first year of entry in Canada, estimated at 0.2% of the quantity of the molecule reimbursed by Canadian private drug plans in 2015 (Table 6.1).
Table 6.2 explores the cost implications of the lower biosimilar capture rates in Canada (0.2%) compared to the median OECD levels (10.1%). The difference in uptake between the OECD median and Canada translates into an estimated $41.7 million in drug sales in Canada in 2015 or 0.2% of the entire Canadian pharmaceutical market for that year. Using the same comparison, the cost difference for the public drug plans analyzed mounted to $16.0 million, representing 0.2% of the overall public drug plan costs.
While biosimilars can offer important savings, the magnitude depends on the uptake in use. Norway, for example, has both the lowest price for the infliximab biosimilars and one of the highest uptakes (67.8%). If the biosimilar uptake in Canada mirrored the uptake in Norway, the cost implications would be substantial: a reduction of $280.1 million in drug expenditures or 1.3% of the entire pharmaceutical market in Canada.
Table 6.2 Estimated sales and cost implications of a lower biosimilar capture rate in Canada compared to the OECD median in 2015
| |
Canadian national market (all payers) |
Public drug plans |
| BC |
AB |
SK |
MB |
ON |
NB |
NS |
PE |
NL |
NIHB |
Total* |
Remicade
drug sales/cost |
$883M |
$84M |
$62M |
$31M |
$33M |
$101M |
$6M |
$10M |
$2M |
$4M |
$6M |
$339M |
Estimated
sales/cost implications at the 10.1% median OECD biosimilar capture rate |
Absolute amounts |
$41.7M |
$4.0M |
$2.9M |
$1.5M |
$1.5M |
$4.8M |
$0.3M |
$0.5M |
$0.1M |
$0.2M |
$0.3M |
$16.0M |
Share of the
pharmaceutical
market |
0.2% |
0.3% |
0.4% |
0.4% |
0.3% |
0.1% |
0.2% |
0.3% |
0.4% |
0.2% |
0.1% |
0.2% |
* Total results for the public drug plans reported in this table.
Sources: Canadian national market: MIDAS™ Database, 2015, IMS AG. All rights reserved.
Public drug plans: National Prescription Drug Utilization Information System Database, Canadian Institute for Health Information, January–December 2015. |
Appendix A: Glossary
Co-paymentFootnote 9: The portion of the claim cost that individuals must pay each time they make a claim. This may be a fixed amount or a percentage of the total claim cost. When calculated as a percentage of the total cost, it is also known as “co-insurance.”
Dispensing fee: A professional fee charged by a pharmacist for the dispensing of a prescription and accepted for reimbursement by a public drug plan.
Drug cost: An amount accepted for reimbursement by a public drug plan that reflects the acquisition cost to the pharmacy for a drug, including the wholesale markups, and excluding markups and dispensing fees.
Markup: An amount accepted for reimbursement by a public drug plan that reflects the difference between the pharmacy retail price and the drug cost.
Patented drug: A drug product with one or more patents issued by the Commissioner of Patents. A patent may be assigned to the active ingredient, a process to manufacture the drug or another aspect, such as a timed-release coating or inhaler mechanism. A patent provides its holder with a monopoly or market exclusivity over the invention for a limited time.
Plan-paid: An amount that a public drug plan reimburses an eligible beneficiary towards the prescription drug expenditure. It reflects the patient cost sharing structure specific to each plan. The patient-paid amounts are paid out-of-pocket by the beneficiary or through another plan/program/insurer.
PrescriptionFootnote 9: A claim where the drug program accepts at least a portion of the cost, either toward a deductible or for reimbursement. Claims reimbursed by a public drug plan and that relate to pharmacy professional services other than the dispensing of medications (such as the medication review or administration of vaccines) are not included in the analysis.
Prescription drug expenditures: The sum of the three components of a prescription: drug costs, markups (if applicable) and dispensing fees. These are amounts accepted by a public drug plan towards the deductible or for reimbursement of eligible beneficiaries. Submitted amounts that were not accepted for reimbursement (drug not reimbursed, unit cost above the accepted price, etc.) are not captured in these amounts. The expenditure totals include both the plan-paid and beneficiary-paid amounts, such as copayments and deductibles.
Public drug plan: This is a general term used to describe drug plans that are administered by provincial, territorial or federal governments. Examples include the public drug plans analyzed in this report. Public drug plans establish eligibility requirements and cost sharing structures, as well as drugs and prices accepted for reimbursement.
Private drug plan: This is a general term used to describe private insurance coverage for prescription drugs provided through employer-sponsored plans or individual insurance. Private drug plans establish eligibility requirements and cost sharing structures, as well as drugs accepted for reimbursement.
Rate of change:
The percent change from one year to another in a drug utilization or expenditure metric. The annual rate of change is calculated over two consecutive years as follows:
[(Value in year 1)/(Value in year 0)] - 1
The compound annual rate of change is calculated over three or more consecutive years as follows:
[(Value in year n)/(Value in year 0)]1/n - 1
Appendix B: Foreign-to-Canadian Price Ratios
The average ratios reported are sales-weighted arithmetic averages of the corresponding foreign-to-Canadian price ratios for individual drugs. These average price ratios provide exact answers to questions such as:
How much more or less would Canadians have paid for the generic drugs they purchased in 2015 had they paid prices prevailing in country X?
The following multilateral measures are reported in this analysis based on the IMS AG’s MIDAS™ database:
Minimum international price—represents the lowest price available across the comparator countries.
Mean international price—represents a straight average of the prices available across the comparator countries.
Median International price—represents the price at the midpoint of the distribution of the foreign prices.
Maximum international price—represents the highest price available across the comparator countries.
Canadian price—represents the average national price based on all manufacturer ex-factory sales in the retail sector in Canada.
Calculating Average Foreign-to-Canadian Price Ratios
This report presents a variety of average foreign-to-Canadian price ratios, similar to those published in PMPRB’s Annual Report. These ratios are constructed as sales-weighted arithmetic averages of the foreign-to-Canadian price ratios obtained at the level of individual drugs.
Algebraically, let
- i = 1 … N, each number identifying a drug included in the calculation
- p(i) = the Canadian price of drug i
- q(i) = the quantity of drug i purchased by Canadians
- X(i) = total amount spent on drug i by Canadians
- pf(i) = the foreign price of drug i (converted to Canadian dollars)
- w(i) = the proportion of Canadians’ expenditure on the drugs 1 to N accounted for by drug i
The sales-weighted arithmetic average of foreign-to-Canadian price ratios (FTC) is given by:
- (G1) FTC = ∑ w(i) [ pf(i) / p(i) ]
where ∑ signifies summation over drugs 1 to N.
With currency conversion at market exchange rates, average ratios constructed this way indicate how much more or less Canadians would have paid for the drugs they purchased had they paid foreign prices instead of Canadian prices. This becomes evident when one observes that:
- (G2) w(i) = p(i) q(i) / X(i)
Using (G2) in (G1) gives:
- (G3) FTC = ∑ [ p(i) q(i) / X(i) ] [ pf(i) / p(i) ]
This equation simplifies to:
- (G4) FTC = [ 1 / X(i) ] ∑ [ pf(i) q(i) ]
The expression ∑ [ pf(i) q(i) ] represents the dollar amount obtained by pricing out quantities at foreign prices, which is to say, the total amount Canadians would have spent had they paid foreign prices. The right-hand side of equation (G4) is the ratio of this hypothetical amount to the amount Canadians actually paid.
Let D represent the difference between the actual and hypothetical amounts paid expressed as a percentage of the former. Then:
Note that D > = < 0 as FTC < = > 1. A value of FTC < 1 thus indicates Canadians would have paid less in total for the drugs they purchased in the relevant period had they paid foreign prices instead of Canadian prices, while an FTC > 1 indicates they would have paid more.
Appendix C: Manufacturer's Basket of Drugs
Table C1. Distribution of the manufacturer’s basket of molecules by therapeutic class*
Public drug plans, 2015
| Therapeutic class (ATC Level 1) |
Janssen |
AbbVie |
Amgen |
Roche |
BMS Canada |
UCB Canada |
Sobi |
| A Alimentary tract and metabolism |
1.5% |
|
|
7.1% |
|
|
|
| B Blood and blood forming organs |
3.4% |
|
6.6% |
|
20.5% |
|
|
| C Cardiovascular system |
0.6% |
|
|
0.5% |
0.1% |
|
|
| D Dermatologicals |
|
|
|
2.4% |
|
|
|
| G Genito-urinary system and sex hormones |
2.2% |
|
|
|
|
|
|
| H Systemic hormonal preparations, excl. sex hormones and insulins |
|
|
0.4% |
1.6% |
0.5% |
|
|
| J Antiinfectives for systemic use |
4.5% |
5.5% |
|
9.1% |
9.4% |
|
|
| L Antineoplastic and immunomodulating agents |
68.5% |
94.1% |
77.4% |
71.8% |
29.6% |
51.5% |
100.0% |
| M Musculo-skeletal system |
|
|
15.6% |
|
|
|
|
| N Nervous system |
19.3% |
0.4% |
|
2.4% |
39.8% |
48.5% |
|
| P Antiparasitic products, insecticides and repellents |
0.1% |
|
|
|
|
|
|
| R Respiratory system |
|
|
|
5.2% |
|
|
|
*Therapeutic classes reported are the level 1 category of the World Health Organization’s Anatomical Therapeutic and Chemical (ATC) classification system.
Source: National Prescription Drug Utilization Information System Database, Canadian Institute for Health Information. |