Annual Report 2007
Table Of Contents
- Mission and Values
- Letter to The Minister of Health
- Highlights 2007
- Chairperson’s Message
- About The Patented Medicine Prices Review Board: Mandate and Jurisdiction
- Governance
- Regulating Prices of Patented Medicines
- Compliance and Excessive Price Guidelines
- Voluntary Compliance Undertakings
- Hearings
- Reporting Information on Key Pharmaceutical Trends
- Trends in Sales of Patented Drugs
- Price Trends
- Comparison of Canadian Prices to Foreign Prices
- Utilization of Patented Drugs
- Manufacturing Trends in Canada
- Canadian Sales in The Global Context
- Analysis of Research and Development Expenditure
- National Prescription Drug Utilization Information System
- Monitoring and Reporting of Non-Patented Prescription Drug Prices
- Amendments to the Patented Medicines Regulations
- Review of the Board’s Excessive Price Gidelines
- Communications
- Glossary
- Acronyms
- Annex 1 - Criteria for Commencing an Investigation
- Annex 2 - Patented Drug Products Introduced in 2007
- Annex 3 - Research & Development
Mission and Values
The mission of the Patented Medicine Prices Review Board (PMPRB) is to protect consumer interests and contribute to Canadian health care by ensuring that prices of patented medicines are not excessive and by analyzing and reporting to Canadians on price trends of all medicines and on research and development conducted by patentees. The PMPRB achieves this by:
- promoting voluntary compliance with the Guidelines established by the Board;
- reviewing prices;
- taking remedial action when necessary;
- consulting with interested parties on Guidelines and other matters of policy; and
- fostering awareness of the Board´s mandate, activities and achievements through communication, dissemination of information and public education.
In fulfilling the mission we are committed to innovative leadership based on the following values:
- effectiveness and efficiency;
- fairness;
- integrity;
- mutual respect;
- transparency;
- supportive and challenging work environment.
The Patented Medicine Prices Review Board
Standard Life Centre
Box L40
333 Laurier Avenue West
Suite 1400
Ottawa, Ontario K1P 1C1
Telephone: (613) 952-7360
Facsimile: (613) 952-7626
TTY: (613) 957-4373
E-mail: pmprb@pmprb-cepmb.gc.ca
Web site: http://www.pmprb-cepmb.gc.ca
All PMPRB publications are available in both official languages, on line or by calling our toll-free number: 1 877 861-2350
Catalogue number: H78-2007; ISBN: 978-0-662-05582-2
PDF: Catalogue number: H78-2007E-PDF; ISBN: 978-0-662-48239-0
Letter to The Minister of Health
Highlights 2007
REGULATORY MANDATE
The PMPRB´s regulatory activities continued to increase in 2007.
Compliance
- Sixty four new patented drug products for human use were reported to the PMPRB in 2007 of which 20 medicines, representing 34 drug products, were new active substances. As of March 31, 2008, 53 new patented drug products had been reviewed. Of those, 47 were considered to be within the Guidelines, while 6 are subject to ongoing investigations.
- A total of 1,178 patented drug products for human use were under the PMPRB´s jurisdiction in 2007.
Enforcement
- The Board approved nine Voluntary Compliance Undertakings, including one in May 2008.
- The Board completed a total of six hearings, issued two Notices of Hearing in 2007 and one at the beginning of 2008. Currently, there are seven ongoing proceedings, including the Nicoderm matter, initiated in 1999.
REPORTING MANDATE
In addition to in-depth analysis of the key pharmaceutical indices, the PMPRB has published two reports under the Non-Patented Prescription Drug Prices initiative.
Sales Trends
- Sales of patented drugs in Canada increased by 3.0% to $12.3 billion in 2007. By comparison, annual growth in sales of patented drugs stood at 27.0% in 1999 and remained in double digits until 2003.
- The share of total sales accounted for by patented drugs declined from 68.1% in 2006 to 66.0% in 2007. This implies that sales of generic and non-patented branded drug products grew at a considerably faster rate than sales of patented drugs.
- Drugs treating the respiratory system and antineoplastics and immunomodulating agents (such as drugs used in chemotherapy) are the leading contributing drug classes to sales growth, the latter for a third consecutive year.
Price Trends
- Prices in Canada – the manufacturers´ prices of patented drugs, as measured by the Patented Medicine Price Index (PMPI), decreased on average by 0.1% in 2007. Again this year, the slight decline in the PMPI is attributable to falling prices paid by hospitals. The PMPI continues to vary by class of customer (hospitals, pharmacies, wholesalers)and across the provinces and territories.
- The Consumer Price Index (CPI) was at 2.1% over the same period. Inflation has exceeded the average increase in patented drug prices almost every year since 1988. This pattern continued in 2007
- Foreign-to-Canadian prices – Canadian prices were the second highest of the seven comparator countries. This ranking is attributable, in part, to currency conversion at market exchange rates. However, U.S. prices remain substantially higher than prices in Canada or any other comparator country.
Resaerch and Development
- Patentees reported total R&D expenditures of $1,325 million in 2007, an increase of 9.5% over the previous year. Rx&D members reported R&D expenditures of $1,184 million in 2007, an increase of 24.4% over 2006.
- Rx&D members accounted for 89.4% of all reported R&D expenditure, while non members reported expenditure of $141 million, a decrease of 45.9% over 2006.
- The R&D-to-sales ratio increased slightly, with 8.3% from 8.1% in 2006, as did the R&D-tosales ratio for members of Rx&D with 8.9% compared to 8.5% in the previous year. The ratios have been below 10% since 2001 and 2003 respectively.
- Patentees reported spending $259.0 million on basic research, representing 20.3% of current R&D expenditures. Basic research increased by 11.4% in 2007 relative to 2006.
Chairperson’s Message
 The year 2007 has been active and challenging for both the Patented Medicine Prices Review Board, and our key stakeholders.
Two key areas of activity drew significant attention during the past year. As part of the Board´s regulatory mandate, there was activity within nine ongoing or newly initiated hearings during 2007, the highest level in the Board´s 20 year history. The review of our Excessive Price Guidelines, an important project initiated in 2006, involved a cooperative effort between the Board, our Staff, and numerous stakeholders.
Since the inception of the PMPRB in 1987, the number of hearings had been maintained at a minimum. This was due in great measure to the effectiveness of the Board´s Excessive Price Guidelines, and our Voluntary Compliance Policy, rather than due to a lack of enforcement.
The Guidelines, first developed in 1989 and revised in 1994, have been, and continue to be, the subject of ongoing discussions. Following concerns expressed relative to the high introductory prices of patented medicines, the Board initiated a series of consultations with its stakeholders in May 2006, with the objective of determining whether, or not, revisions to the Excessive Price Guidelines were required. The process continues in a fair and transparent manner.
In 2007, the process included numerous face-to-face bilateral meetings with our stakeholders which built upon multilateral forums held in 2006. We heard the opinions from representatives of all three sectors of the pharmaceutical industry, i.e., brand name, biotech and generic, relating to the challenges they face within the current environment, including the impact of globalization on their research and marketing activities, and the influence of various regulatory regimes. Consumer and patient advocacy groups expressed their concern regarding access to necessary medicines, at affordable prices. Public and private drug plans have also participated in our consultations, and have provided their views regarding affordable and sustainable access to pharmaceuticals in Canada. In January of 2008, we released a paper requesting feedback on the proposed changes to the Guidelines that derived from the consultations, as well as on a range of options to address the issues that arose from the decision of the Federal Court of Canada in the LEO Pharma matter.
The March 2007 Federal Court decision raised a controversy. It was interpreted by some as creating disincentives for patentees in offering various benefits to patients. The Board has worked diligently in trying to address this issue in its revised Guidelines, and possibly, in amendments that were suggested to the Patented Medicines Regulations. The Board is committed to its primary role of protecting consumers´ interests by ensuring that prices of patented medicines in Canada are not excessive.
During 2007, our reporting mandate also provided several challenges. We introduced the New Drug Pipeline Monitor, which provides drug plan managers and others with information relating to newly developed drug products. Two studies were also published relating to non-patented prescription drug prices, and we initiated a series of new projects under the National Prescription Drug Utilization Information System (NPDUIS) which include research examining the potential impact of long-term demographic change on public drug plans, recent trends in dispensing fees reimbursed by drug plans, and methodological alternatives for measuring volumes of treatment in utilization analysis. Also, we are proceeding with the upcoming publication of the new edition of the Pharmaceutical Trends Overview Report, the second installment of our New Drug Pipeline Monitor report, and the publication of a methodology and management tool for forecasting Drug Plan Expenditures.
We will continue to provide our stakeholders with the opportunity to participate in the ongoing consultation activities, which is a critically important part of the Board´s efforts to reach decisions that are balanced and fair, and which will serve all Canadians effectively.
I wish to take this opportunity to thank the Board Members for their tireless efforts during this period of high activity, as well as the Staff who have taken on the new consultation initiatives with enthusiasm, while continuing with their regular activities, and all of the stakeholders, who continue to help with the development of new guidelines and policies.
Brien G. Benoit, MD
Chairperson
About The Patented Medicine Prices Review Board: Mandate and Jurisdiction
The Patented Medicine Prices Review Board is an independent quasi-judicial body established by Parliament in 1987 under the Patent Act (Act). The Minister of Health is responsible for the pharmaceutical provisions of the Act as set out in sections 79 to 103.
Although part of the Health Portfolio, the PMPRB carries out its mandate at arm´s length from the Minister of Health.1 It also operates independently of other bodies such as Health Canada, which approves drugs for safety and efficacy, and public drug plans, which have responsibility for approving the listing of drugs on their respective formularies for reimbursement purposes.
MANDATE
The PMPRB has a dual role:
Regulatory
To ensure that prices charged by patentees for patented medicines sold in Canada are not excessive, thereby protecting consumers and contributing to Canadian health care.
Reporting
To report on pharmaceutical trends of all medicines, and on R&D spending by pharmaceutical patentees, thereby contributing to informed decisions and policy making.
JURISDICTION
Regulatory
The PMPRB is responsible for regulating the prices that patentees charge – the factory-gate price – for prescription and non-prescription patented drugs sold in Canada to wholesalers, hospitals, pharmacies or others, for human and veterinary use, to ensure that they are not excessive. The PMPRB regulates the price of each patented drug product, including each strength of each dosage form of each patented medicine sold in Canada. This is normally the level at which Health Canada assigns a Drug Identification Number (DIN).
Health Canada assesses new medicines to ensure that they conform to the Food and Drugs Act and the Food and Drug Regulations. Formal authorization to market or distribute a medicine is granted through a Notice of Compliance (NOC). A medicine may be temporarily distributed with specified restrictions before receiving an NOC, as an Investigational New Drug or under Health Canada´s Special Access Programme (SAP).
The PMPRB has no authority to regulate the prices of non-patented drugs, and does not have jurisdiction over prices charged by wholesalers or retailers, or over pharmacists´ professional fees. Also, matters such as whether medicines are reimbursed by public drug plans, distribution and prescribing are outside the purview of the PMPRB.
Under the Patented Medicines Regulations, patentees are required to file price and sales information twice a year for each strength of each dosage form of each patented medicine sold in Canada for price regulation purposes. Patentees are also required to file R&D expenditures once a year for reporting purposes.
Patentees are also required to inform the PMPRB of their intention to sell a new patented medicine. They are not required to obtain approval of the price of a patented medicine before it is sold, but they are required to comply with the Act to ensure that prices of patented medicines sold in Canada are not excessive. In the event that the Board finds, after a public hearing, that a price is or was excessive in any market, it may order the patentee to reduce the price and take measures to offset any excess revenues it may have received.
Reporting
The PMPRB reports annually to Parliament, through the Minister of Health, on its activities, on pharmaceutical trends relating to all medicines, and on the R&D spending by pharmaceutical patentees. In addition to these reporting responsibilities, under section 90 of the Act, the Minister of Health has the authority to direct the PMPRB to inquire into any other matter. Under this provision, the Minister has directed the Board to undertake two initiatives: the National Prescription Drug Utilization Information System (NPDUIS), and monitoring and reporting on Non-Patented Prescription Drug Prices (NPPDP).
National Prescription Drug Utilization Information System
Since 2001, pursuant to an agreement by the Federal/Provincial/Territorial Ministers of Health, the PMPRB has been conducting research under the NPDUIS. The purpose of the NPDUIS is to provide critical analyses of price, utilization and cost trends so that Canada´s health system has more comprehensive and accurate information on how prescription drugs are being used and on sources of cost increases.
Non-Patented Prescription Drug Prices
In 2005, the Minister of Health, on behalf of himself and his provincial and territorial colleagues, directed the PMPRB to monitor and report on non-patented prescription drug prices. This function is aimed at providing a centralized credible source of information on non-patented prescription drug prices.
As of April 2008, NPPDP studies are conducted under the umbrella of the NPDUIS.
1 The Health Portfolio contributes to specific dimensions of improving the health of Canadians. It comprises Health Canada, the Public Health Agency of Canada, the Canadian Institutes of Health Research, the Hazardous Materials Information Review Commission, the Assisted Human Reproduction Agency of Canada and the Patented Medicine Prices Review Board.
Governance
The Board consists of not more than five members who serve on a part-time basis. Board Members, including a Chairperson and a Vice-Chairperson, are appointed by the Governor-in-Council. The Chairperson is designated under the Patent Act as the Chief Executive Officer of the PMPRB with the authority and responsibility to supervise and direct its work.

MEMBERS OF THE BOARD
Chairperson
Brien G. Benoit, BA, MD, MSc, FRCSC, FACS
Brien G. Benoit was first appointed as a Member of the PMPRB in May of 2005, and in October of the same year, he became Vice-Chairperson assuming the responsibilities of Chairperson until his permanent appointment in June 2006.
A neurosurgeon, Dr. Benoit is on the Active Attending Staff of The Ottawa Hospital, and is a Professor of Neurosurgery at the University of Ottawa, regularly involved in the training of neurosurgical residents. Throughout his career, he has held several administrative positions including Chief of Neurosurgery of the Ottawa Civic/The Ottawa Hospital (1980-2003), Chief of Surgery of the Ottawa Civic Hospital (2002-2003), Program Director for Neurosurgery at the University of Ottawa (1995-2003), Chair of Neurosurgery at the University of Ottawa (1997-2003) and Deputy Surgeon-in-Chief of The Ottawa Hospital – Civic Campus (2002-2004).
Dr. Benoit has published extensively in leading academic journals, and has participated in several multi-centre clinical trials. He was awarded Best Surgical Teacher from the Department of Surgery at the University of Ottawa in 1991 and 2000.
In addition to being a Fellow of the Royal College of Physicians and Surgeons of Canada, Dr. Benoit is a member of several professional associations including the Canadian Medical Association, the Ontario Medical Association, The American College of Surgeons, The Canadian Neurosurgical Society and the Congress of Neurological Surgeons.
VICE-CHAIRPERSON
Mary Catherine Lindberg, BSP
Mary Catherine Lindberg was appointed Member and Vice-Chairperson of the Board in June 2006.
Ms. Lindberg is currently the Executive Director of the Council of Academic Hospitals of Ontario (CAHO), an organization of 25 Academic Hospitals that are fully affiliated with a University and its Faculty of Medicine. Prior to retiring from the Ministry of Health and Long Term Care, she was an Assistant Deputy Minister with responsibilities for registration and eligibility for the Ontario Health Insurance Plan (OHIP), payment to physicians, the Ontario Drug Program and the Laboratories.
Some of her major activities were the development and introduction of the Trillium Drug Program, leading negotiations for the government with physicians, pharmacists, chiropractors, physiotherapists, optometrists and private laboratory owners. Ms. Lindberg has a degree in pharmacy from the University of Saskatchewan and has her pharmacist´s license in the provinces of both Saskatchewan and Ontario.
MEMBERS
Thomas (Tim) Armstrong, BA, LLB, QC, O. Ont.
Tim Armstrong was first appointed Member of the Board in October 2002. He was re-appointed for a second term in 2007.
Mr. Armstrong practiced law from 1958 to 1974, first in the Civil Litigation Division of the federal Department of Justice, subsequently in private practice in Toronto with Jolliffe, Lewis & Osler and later as senior partner of Armstrong & MacLean, specializing in administrative law litigation, presenting cases to administrative tribunals, the Ontario courts, the Federal Court, and the Supreme Court of Canada.
In 1974, he began his career as a senior Ontario public servant as Chair of the Ontario Labour Relations Board (1974-1976), Deputy Minister of Labour (1976-1986), Agent General for Ontario in Tokyo (1986-1990), and Deputy Minister of Industry, Trade and Technology (1991-1992). He was advisor to the Premier of Ontario on Economic Development from 1992 to 1995. Mr. Armstrong was counsel to the law firm McCarthy Tétrault from 1995 to 2002. In the 1990´s, he served as a member on the boards of directors of Algoma Steel, deHavilland Aircraft and Interlink Freight.
He has been Chief Representative for Canada for the Japan Bank for International Cooperation since 1996 and also serves as arbitrator and mediator by consensual, provincial and federal government appointment in the field of labour relations. In his dispute resolution work, he was appointed facilitator/mediator by the Ontario Health Services Restructuring Commission from 1998-1999. Subsequently, in 2002-2003, he was designated by the Ontario government as mediator/arbitrator under the City of Toronto Labour Disputes Resolution Act, 2002.
He is currently the Chair of the Radiation Safety Institute of Canada and Vice-Chair of the Ontario Press Council.
Mr. Armstrong was awarded the Order of Ontario in 1995 in recognition of his contribution to public service in Ontario.
Anthony Boardman, BA, PhD
Anthony Boardman was appointed Member of the Board in January 1999 and was re-appointed in March 2005.
Dr. Boardman is the Van Dusen Professor of Business Administration in the Strategy and Business Economics Division of the Sauder School of Business at the University of British Columbia (UBC). He graduated from the University of Kent at Canterbury (BA, 1970), and Carnegie-Mellon University (PhD, 1975). Prior to taking up his position at UBC he was a professor at the Wharton School, University of Pennsylvania.
His current research interests include public-private partnerships, cost-benefit analysis and strategic management. Dr. Boardman has been a consultant to many private and public organizations including Vodafone, Stora Enzo, PricewaterhouseCoopers, the Treasury of New Zealand and all levels of government in Canada. He has taught executive programs in Finland, China, Australia and elsewhere, and has won a number of teaching awards. As a member of the MBA Core Team at UBC, he won the Alan Blizzard award. Between 1995 and 2001, Dr. Boardman was a member of the Pharmacoeconomic Initiative Scientific Committee in BC. Currently, he is a member of the National Academies Committee on Medical Isotope Production Without Highly Enriched Uranium.
During his career, Dr. Boardman has published many articles in leading academic journals. Currently, he is working on the fourth edition of Cost-Benefit Analysis: Concepts and Practice.
Anne Warner La Forest, LLB (UNB), LLM (Cantab)
Anne Warner La Forest was appointed Member of the Board in March 2007.
Ms. La Forest is currently a law professor at the University of New Brunswick. Member of the New Brunswick Securities Commission since 2004, she is also the Chair of the Commission´s Human Resources Committee.
After working in private practice with the firm of Fraser & Beatty in Toronto for several years, Ms. La Forest joined the Faculty of Law at Dalhousie University in 1991. In 1996, she was appointed Dean of the New Brunswick University Faculty of Law, a position she held until 2004.
A member of the bars of New Brunswick, Nova Scotia and Ontario, Ms. La Forest has extensive experience as an arbitrator and has acted as a consultant on matters relating to human rights, employment, property and extradition law. She has been a member of the Nova Scotia Human Rights Tribunal, a member of the Social Sciences and Humanities Research Council and Chair of the Fellowships Committee. She has also served as Arbitrator in the province of Nova Scotia as well as Commissioner of the province´s Human Rights Commission. She is a Fellow of the Cambridge Commonwealth Society and is currently a member of the Board of Governors of the National Judicial Institute.
She holds an LL.M. degree in International Law from Cambridge University in the United Kingdom.
Ms. La Forest has published many articles, books and case comments during her career and has been the chair or has served as a panelist at many national and international law conferences.
PMPRB Senior Staff
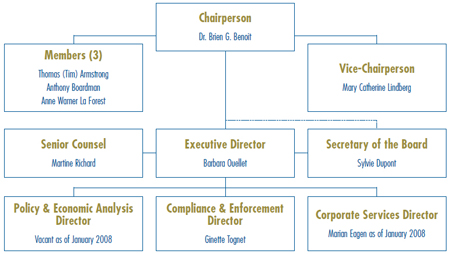
The Executive Director manages the work of the Staff. In addition to the Executive Director, Senior Staff consists of the Director of Compliance and Enforcement, the Director of Policy and Economic Analysis, the Director of Corporate Services, the Secretary of the Board, and Senior Counsel.
Executive Director
Is responsible for overall leadership of the operations of the PMPRB and of Staff.
Compliance and Enforcement
Reviews the prices of patented medicines sold in Canada to ensure that they are not excessive; encourages patentees to comply voluntarily with the Board´s Excessive Price Guidelines; implements related compliance and enforcement policies; and investigates complaints into the prices of patented medicines.
Policy and Economic Analysis
Develops policy advice on possible changes to the Board´s Excessive Price Guidelines and on other issues, as needed; analyzes pharmaceutical trends and prepares reports; and conducts studies both in support of Compliance and Enforcement and as directed by the Minister of Health.
Corporate Services
Administers the Board´s internal policies: Human Resources, Financial Management, and Information Technology.
Secretary of the Board
Develops and manages the PMPRB´s communications, media relations and public enquiries; manages the Board´s hearing process, including the official record of proceedings; and coordinates activities pursuant to the Access to Information Act and the Privacy Act ; and
Senior Counsel
Advises the PMPRB on legal matters and leads the prosecution team in proceedings before the Board.
Budget
The PMPRB operated with a budget of $11,525,000 in 2007-2008 and an approved staff level of 62 full-time equivalent employees. In addition to a budget for carrying out its mandate, the PMPRB budget included resources for the National Prescription Drug Utilization Information System (NPDUIS) and for the monitoring and reporting on Non-Patented Prescription Drug Prices (NPPDP), as mandated by the Minister of Health.
Regulating Prices of Patented Medicines
- Compliance and Excessive Price Guidelines
- Voluntary Compliance Undertakings
- Hearings
Compliance and Excessive Price Guidelines
Under section 82 of the Patent Act (Act), pharmaceutical patentees are required to notify the PMPRB of their intention to offer a patented drug product for sale and the date on which they expect to begin selling it.
Under the Patented Medicines Regulations (Regulations), patentees are subsequently required to:
- file a Medicine Identification Sheet (Form 1) within 7 days after either the issuance of a Notice of Compliance or the date on which the patented drug product was first sold in Canada, whichever comes first. A copy of the product monograph, or information similar to that contained in a product monograph when an Notice of Compliance has not been issued, must also be filed at the same time as Form 1;
- report information on the introductory prices and sales covering the first day of sale in Canada of new patented drug products (Form 2), within 30 days of the date of first sale; and
- continue to file detailed information on prices and sales of each patented drug product for the first and last six-month periods of each year (Form 2), 30 days after the end of each period, i.e., on July 30 and January 30 respectively, for as long as the drug product remains under the Board´s jurisdiction.
The PMPRB reviews the pricing information for all patented medicines sold in Canada on an ongoing basis to ensure that the prices charged by patentees comply with the Excessive Price Guidelines (Guidelines) established by the Board. The Guidelines are published in the PMPRB´s Compendium of Guidelines, Policies and Procedures.2
Excessive Price Guidelines
- The Guidelines are based on the price determination factors in section 85 of the Act and have been developed by the Board in consultation with stakeholders, including the provincial and territorial Ministers of Health, consumer groups and the pharmaceutical industry. In summary, the Guidelines provide that:
- prices for most new patented drug products are limited such that the cost of therapy for the new drug product does not exceed the highest cost of therapy for existing drug products used to treat the same disease in Canada;
- prices of new breakthrough patented drug products and those that bring a substantial improvement are generally limited to the median of the prices charged for the same patented drug product in other industrialized countries listed in the Regulations (France, Germany, Italy, Sweden, Switzerland, the United Kingdom and the United States);
- price increases for existing patented drug products are limited to changes determined by the Board´s Consumer Price Index (CPI) methodology; and
- prices of patented drug products in Canada may at no time exceed the highest price for the same patented drug product in the foreign countries listed in the Regulations.
When Board Staff finds that the price of a patented drug product appears to exceed the Guidelines, and the circumstances meet the criteria for commencing an investigation, Board Staff will conduct an investigation to determine if the price of the patented drug product in fact exceeds the Guidelines. Additional information on the criteria for commencing an investigation is available in Annex 1, on page 55. An investigation could result in:
- its closure where it is concluded that the price was within the Guidelines;
- a Voluntary Compliance Undertaking (VCU) by the patentee to reduce the price and take other measures to comply with the Guidelines, including the repayment of excess revenues obtained as a result of excessive prices; or
- a public hearing to determine if the price is excessive and to make any remedial Order determined by the Board.
The list of New Patented Medicines Reported to the PMPRB is posted on its Web site every month. This list includes information on the status of the review of new patented medicines, i.e., under review, within Guidelines, under investigation, VCU, or Notice of Hearing.
Failure to Report
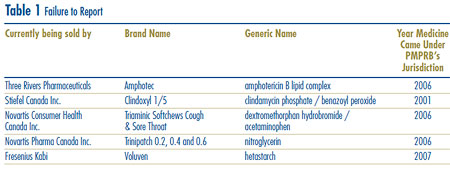
In order to fulfill its regulatory mandate, as described on page 2, the PMPRB relies upon the patentees´ full and timely disclosure of any and all medicines being sold in Canada to which a patent pertains. Late filing by patentees is an important issue because it may delay the price review. Although, in most cases, patentees ultimately comply with the filing requirements, an issue exists regarding a number of patentees´ failure to report complete information within the time frames specified in the Regulations. Five new drug products (8 DINs) were first reported to the PMPRB in 2007 although they had been patented and sold previously. See Table 1. Amphotec (two DINs), Clindoxyl 1/5, Triaminic Softchews Cough & Sore Throat, Trinipatch (three DINs) and Voluven were patented and sold in Canada prior to being reported as being under the PMPRB´s jurisdiction. They are currently being sold by Three Rivers Pharmaceuticals, Stiefel Canada Inc., Novartis Consumer Health Canada Inc., Novartis Pharma Canada Inc., and Fresenius Kabi, respectively.
Failure to File (FTF)
The Board is pleased to report that there were no Board Orders issued for the January to June and July to December 2007 filing periods. It is a patentee´s statutory responsibility to ensure complete information is filed within the statutory time frame. Information on the statutory reporting requirements is available in the Act, the Regulations, the Guidelines, and the Patentee´s Guide to Reporting, all of which can be found on the PMPRB Web site under Legislation, Regulations and Guidelines.
Human Drug Advisory Panel
The Board established the Human Drug Advisory Panel (HDAP) to provide recommendations for the categorization of new drug products and the selection of comparable drug products. The mandate of the HDAP is to provide credible, independent and expert scientific advice to the PMPRB respecting the development and application of the Guidelines related to the scientific evaluation of patented medicines. The approach is evidence-based and the recommendations reflect medical and scientific knowledge and current clinical practice.
The HDAP is comprised of three members:
- Dr. Jean Gray MD, FRCPC, Professor Emeritus of medical education, medicine and pharmacology at Dalhousie University;
- Dr. Mitchell Levine MD, MSc, FRCPC, FISPE, Professor, Department of Clinical Epidemiology and Biostatistics, St. Joseph´s Healthcare Hamilton Centre for Evaluation of Medicines; and
- Dr. Adil Virani, Director of Pharmacy Services at the Fraser Health Authority and Assistant Professor in the Faculty of Pharmaceutical Sciences at the University of British Columbia (appointed on April 1, 2008). The PMPRB recently bid farewell to Dr. James McCormack as he completed his mandate as a member of the HDAP. His expert advice and invaluable contribution to the scientific review of new patented medicines since 2002 will be long remembered.
During 2007 the HDAP reviewed a total of 50 drug products.
New Patented Drug Products in 2007
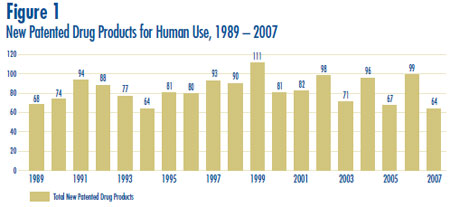
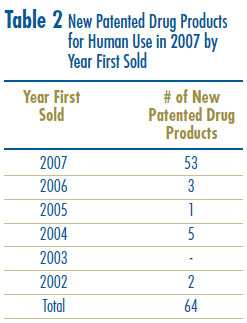
There were 64 new patented drug products3 for human use introduced in 2007. Some are one or more strengths of a new active substance (NAS) and others are new presentations of existing medicines.
For purposes of the price review, a new patented drug product in 2007 is defined as any patented drug product first sold in Canada, or previously sold but first patented between December 1, 2006 and November 30, 2007.4
Figure 1 below provides information on new patented drug products for human use from 1989 to 2007.
Eleven (17%) of the 64 new patented drug products were being sold in Canada prior to the issuance of a Canadian patent which brought them under the PMPRB´s jurisdiction. These are denoted by a “FPG” (first patent granted) in Annex 2 on page 56. Table 2 identifies the number of patented drug products by the year in which they were first sold. The time delay between date of first sale and date of patent grant for these products ranged from several months to five years.
New Active Substances in 2007
A new active substance (NAS) may include more than one drug product if it is sold in more than one strength or dosage form. In 2007, there were 20 NASs marketed as 34 drug products. As shown in Figure 2 and Table 3, four of the 20 patented NASs that came under the PMPRB´s jurisdiction were sold prior to 2007.
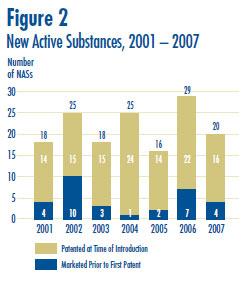
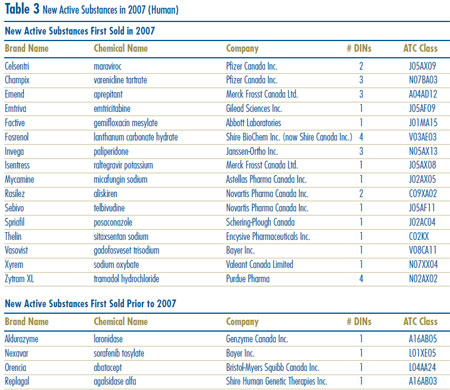
The PMPRB´s list of patented NASs in any year may differ from the list of NASs approved by Health Canada´s Therapeutic Products Directorate (TPD) for the following reasons:
- the NAS is not patented and therefore not subject to the PMPRB´s jurisdiction;
- the NAS may not be on the TPD list because it is being sold under the Special Access Programme (SAP) before it receives a Notice of Compliance (NOC); or
- the NAS may have been approved, but is not being sold. Health Canada reported 20 NASs in 2007 but not all were introduced to the market in that year.5
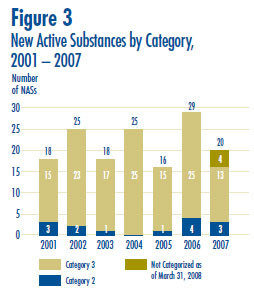
Figure 3 provides a breakdown of the patented NASs for human use, by category assigned for price review purposes, over the seven-year period 2001 through 2007 inclusive.6 Summary Reports of the price reviews of NASs are posted on the PMPRB Web site when the price review is completed and the price is within the Guidelines.7
Price Review of New Patented Drugs for Human Use
A list of the 64 new patented drug products and their price review status appears in Annex 2, on page 56. Of the 64 new patented drug products:
- the prices of 53 had been reviewed as of March 31, 2008;
- 47 were found to be within the Guidelines;
- 6 were priced at levels which appeared to exceed the Guidelines based on the introductory price tests and investigations were commenced.8 For a more detailed explanation of the criteria for commencing an investigation, please refer to Annex 1, on page 55; and
- the prices of 11 new patented drug products are still under review.
Patented Over-the-Counter Drug Products
Amendments to the Patented Medicines Regulations were registered on March 6, 2008 and published in the Canada Gazette, Part II, on March 19, 2008. Changes have been made to the approach for regulating the prices of patented over-the-counter (OTC) drug products. Board Staff will only review the price of a patented OTC drug product when a complaint has been received. Refer to the Compendium of Guidelines, Policies and Procedures for further information.
Price Review of Existing Patented Drugs for Human Use
For the purpose of this report, existing drug products include all patented drug products that were first sold and reported to the PMPRB prior to December 1, 2007. The Guidelines limit the price changes for existing patented drugs to changes in the Consumer Price Index (CPI) based on the methodology developed by the Board. In addition, the price of a patented drug product cannot exceed the highest price of the same patented drug product in the countries listed in the Regulations (France, Germany, Italy, Sweden, Switzerland, the United Kingdom, and the United States).
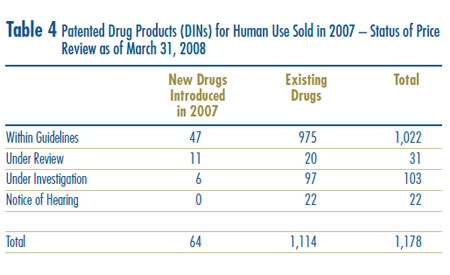
At the time of this report, there were 1,114 existing drug products:
- the prices of 975 existing drug products (87.5%) were within the Guidelines;
- 20 existing drug products were still under review.
- 97 existing drug products were the subject of investigations (see previous paragraph for price tests applied to existing drug products);
- 37 were opened in 2007
- 31 were opened in 2006
- 14 were opened in 2005
- 1 was opened in 2003
- 1 was opened in 2004 as a result of introductory pricing
- 1 was opened in 2005 as a result of introductory pricing
- 12 were opened in 2006 as a result of introductory pricing
- 22 existing drug products – Nicoderm (three DINs), Adderall XR (six DINs), Copaxone, Concerta (four DINs), Strattera (five DINs), Penlac, Quadracel, Pentacel – were, or are currently, the subject of a hearing under section 83 (see Hearings, on page 18).
A summary of the status of the price review of the new and existing patented drug products for human use in 2007 is provided in Table 4.
CDR / PMPRB
The Common Drug Review (CDR) is a single process for reviewing new drugs and providing formulary listing recommendations to participating publicly-funded federal, provincial and territorial drug benefit plans in Canada. All jurisdictions are participating in the CDR except Québec. The CDR reviews new drugs and provides an evidence-based formulary listing recommendation made by the Canadian Expert Drug Advisory Committee (CEDAC). The drug plans consider the CEDAC recommendation and also their individual plan mandates, priorities and resources when making formulary listing and coverage decisions. More information on CDR and CEDAC is available from the Canadian Agency for Drugs and Technologies in Health (CADTH) Web site (http://www.cadth.ca).
Table 5 provides information on CDR reviews and on the PMPRB price reviews. The CDR reviews drug products following the issuance of an NOC. The PMPRB reviews all patented medicines sold in Canada. A medicine may be sold prior to the issuance of a patent. As such, it would not be under the PMPRB´s jurisdiction.
Table 5 Review Status
| Brand Name |
Company |
CEDAC RECOMMENDATION in 2007 Generic Name |
PMPRB STATUS |
| AltaceHCT |
Sanofi-Aventis Canada Inc. |
ramipril/hydrochlorothiazide |
To List |
Within Guidelines |
| Azilect |
Teva Neurosciences |
rasagiline mesylate |
Do not list |
Under Investigation |
| Baraclude |
Bristol-Myers Squibb Canada |
entecavir |
To List* |
Within Guidelines; |
| Champix |
Pfizer Canada Inc. |
varenicline tartrate |
To List* |
Within Guidelines |
| Cipralex |
Lundbeck Canada Inc. |
escitalopram oxalate |
Do not list |
Within Guidelines |
| Ciprodex |
Alcon Canada Inc. |
ciprofloxacin hydrochloride & dexamethasone otic suspension |
To List* |
Under Investigation |
| Denavir |
Novartis Consumer Health Care Inc. |
penciclovir |
Do not list |
Under Investigation |
| Elaprase |
Shire Human Genetic Therapies, Inc. |
idursulfase |
Do not list |
Not Under PMPRB Jurisdiction |
| Exjade |
Novartis Pharmaceuticals Canada Inc. |
deferasirox |
To List* |
Within Guidelines |
| Hepsera |
Gilead Sciences Canada Inc. |
adefovir dipivoxil |
To List* |
Within Guidelines |
| Humira |
Abbott Laboratories, Limited |
adalimumab |
To List* |
Within Guidelines |
| Myozyme |
Genzyme Canada Inc. |
alglucosidase alfa |
To List* |
Not Under PMPRB Jurisdiction |
| Nexavar |
Bayer Inc. |
sorafenib tosylate |
Do not list |
Within Guidelines |
| Orencia |
Bristol-Myers Squibb Canada |
abatacept |
To List* |
Within Guidelines |
| Prexige |
Novartis Pharmaceuticals Canada Inc. |
lumiracoxib |
Do not list |
Not Under PMPRB Jurisdiction |
| Prezista |
Janssen-Ortho Inc. |
darunavir |
To List* |
Within Guidelines |
| Raptiva |
Serono Canada Inc. |
efalizumab |
|
Not Under PMPRB Jurisdiction |
| Revatio |
Pfizer Canada Inc. |
sildenafil citrate |
To List** |
Within Guidelines |
| Rituxan |
Hoffmann-La Roche Limited |
rituximab |
To List* |
Within Guidelines |
| Sativex |
GW Pharma Ltd. |
delta-9-tetrahydrocannabinol /cannabidiol |
Do not list |
Within Guidelines |
| Sebivo |
Novartis Pharmaceuticals Canada Inc. |
telbivudine |
Do not list |
Within Guidelines |
| Somatuline Autogel |
Ipsen Limited |
lanreotide acetate |
To List** |
Not Under PMPRB Jurisdiction |
| Sutent |
Pfizer Canada Inc. |
sunitinib malate |
Do not list |
Within Guidelines |
| Tramacet |
Janssen-Ortho Inc. |
tramadol hydrochloride /acetaminophen |
Do not list |
Within Guidelines |
| Tysabri |
Biogen Idec Canada Inc. |
natalizumab |
Do not list |
Under Investigation |
| Vantas |
Paladin Labs Inc. |
histrelin acetate |
Do not list |
Patented - No sales reported |
| Vesicare |
Astellas Pharma Canada Inc. |
solifenacin succinate |
Do not list |
Within Guidelines |
| Zytram XL |
Purdue Pharma |
tramadol hydrochloride |
Do not list |
Under Review |
Sources: PMPRB and CADTH
* List with criteria/condition
** List in a manner similar to other drugs in class
Update of New Patented Drug Products reported in previous Annual Reports
Table 6 provides an update of the review status of new patented drug products reported in previous years´ Annual Reports.
Table 6 Summary of Review Status of New Patented Drug Products Reported to the PMPRB in 2002, 2003, 2004, 2005, 2006 and 2007
|
2002 |
2003 |
2004 |
2005 |
2006 |
2007 |
| New Patented Drug Products reported in Annual Report |
94 |
70 |
94 |
66 |
99 |
64 |
| Failure to file reported after publication of Annual Report |
4 |
1 |
2 |
1 |
6 |
n/a |
| Total for year |
98 |
71 |
96 |
67 |
105 |
64 |
| Under Review |
0 |
0 |
0 |
0 |
12 |
11 |
| Within Guidelines |
91 |
66 |
78 |
58 |
80 |
47 |
| Investigation |
0 |
0 |
1 |
1 |
12 |
6 |
| Voluntary Compliance Undertaking (VCU) |
3 (Starlix) 1 (Busulfex) 1 (Tamiflu) |
1 (Dukoral) |
2 (Paxil CR) 1 (Hextend) 2 (Eloxatin) 1 (Forteo) |
1 (Nuvaring) 1 (Vaniqa) |
1 (Lantus) |
|
| Notice of Hearing (NOH) |
|
3 (Concerta) |
6 (Adderall XR) 1 (Penlac) |
5 (Strattera) 1 (Concerta) |
|
|
| NOH/VCU |
1 (Fasturec) |
1 (Evra) |
3 (Risperdal Consta) |
|
|
|
| NOH Complete |
1 (Dovobet) |
|
1 (Copaxone) |
|
|
|
Update of Existing Medicines from the 2006 Annual Report
In the 2006 Annual Report, it was reported that, of the 1,082 existing patented drug products for human use sold in 2006, the prices of 17 were still under review. The results of those reviews concluded that: 6 drug products were within the Guidelines; 4 drug products were priced at levels that appeared to exceed the Guidelines and therefore investigations were initiated; and 8 are still under review, one of which was added due to failure to report.
In last year´s Report, the PMPRB had also reported that 65 patented drug products were under investigation. Of those, 17 investigations have been concluded: in 13 cases the prices were ultimately found to be within the Guidelines; and for 4 cases, VCUs were approved – Forteo, Octreoscan, Vaniqa, and Zemplar. (See Voluntary Compliance Undertakings.) Forty-eight are still under investigation. Also in last year´s Annual Report, it was reported that 27 drug products were the subject of a Notice of Hearing. At the time of this report, four hearings have been concluded; Airomir, Copaxone, Dovobet and Risperdal Consta (3 DINs). The hearings involving the remaining 22 drug products are ongoing.
Patented Drug Products for Veterinary Use
The complaints-driven approach for regulating the prices of patented veterinary drug products remained in place for 2007. Board Staff only reviews the introductory prices of new patented veterinary drug products. Existing drug products are subject to review only when a complaint with significant evidence has been received. No complaints were received in 2007.
In last year´s Annual Report, it was reported that one patented drug product for veterinary use was under review and it remains under review at the time of this report. In 2007, seven new patented drug products were reported to the PMPRB. These are under review. Summary reports of the price reviews of patented drug products for veterinary use are made available on the PMPRB Web site under Regulatory; Patented Medicines; Reports on New Patented Drugs for Veterinary Use.
Amendments to the Patented Medicines Regulations were registered on March 6, 2008 and published in the Canada Gazette, Part II, on March 19, 2008. Changes have been made to the complaints-driven approach for regulating the prices of patented veterinary drug products. Board Staff will only review the price of a patented drug product for veterinary use when a complaint has been received. Refer to the PMPRB Web site for further information.
2 The Compendium of Guidelines, Policies and Procedures (Compendium) is available on the PMPRB Web site under Legislation, Regulations and Guidelines, or by calling the toll-free number: 1 877 861-2350.
3 The PMRPB reviews the prices of each unique strength and dosage form of a medicine. This is the level at which Health Canada issues a DIN when a drug product receives approval to sell in Canada (i.e., the Notice of Compliance - NOC). Not all new patented drug products have a DIN – for example, when a drug product is available to patients under Health Canada´s Special Access Programme.
4 Because of timing of the filing requirements under the Patented Medicines Regulations, and the manner of calculating benchmark prices, drug products introduced or patented in December are considered to be new patented products in the following year.
5 Annual Drug Submission Performance Report, Section 4, January-December 2007, Therapeutic Products Directorate, Health Canada.
6 For purposes of conducting price reviews for new drug products, the PMPRB categorizes new drug products as follows:
- Category 1 – a new DIN of an existing dosage form of an existing medicine, or a new DIN of another dosage form of the medicine that is comparable to the existing dosage form.
- Category 2 – is one that provides a breakthrough or substantial improvement. It is a new DIN of a non-comparable dosage form of an existing medicine or the first DIN of a new chemical entity.
- Category 3 – a new DIN of a non-comparable dosage form of an existing medicine or the first DIN of a new chemical identity. These DINs provide moderate, little or no therapeutic advantage over comparable medicines. This group includes those new drug products that are not included in Category 2.
For complete definitions of the categories, refer to the Compendium of Guidelines, Policies and Procedures, Chapter 3, section 3, page 21.
7 Summary Reports for new patented drugs for human use are available under Regulatory; Patented Medicines; Reports on New Patented Drugs for Human Use.
8 The Guidelines provide that the following price tests will be used to determine whether an introductory price is excessive: the Reasonable Relationship test; the Therapeutic Class Comparison test; the Median of International Price Comparison test; and the Highest International Price Comparison test. For more information on their application, please consult the Compendium of Guidelines, Policies and Procedures (Compendium) available on the PMPRB Web site under Legislation, Regulations and Guidelines, or by calling the toll-free number: 1 877 861-2350.
Voluntary Compliance Undertakings
A Voluntary Compliance Undertaking (VCU) is a written undertaking by a patentee to adjust the price of a patented drug product to conform to the Excessive Price Guidelines (Guidelines).
Under the Compliance and Enforcement Policy, patentees are given an opportunity to submit a VCU when Board Staff concludes, following an investigation, that the price at which a patentee is selling or has sold a patented medicine in Canada appears to have exceeded the Guidelines.
Publication of VCU
VCUs are published upon their approval by the Chairperson. Once a patentee has been informed that the terms of a VCU have been approved, the document becomes public. In the context of the PMPRB´s policy on compliance and enforcement, VCUs are posted on our Web site, reported in our NEWSletter, and included in the Annual Report.
Approval of a VCU by the Chairperson is an alternative compliance mechanism to the commencement of formal proceedings through the issuance of a Notice of Hearing.
Under the PMPRB´s Compliance and Enforcement Policy, a VCU can also be submitted following the issuance of a Notice of Hearing. A VCU submitted at this point must be approved by the Hearing Panel.
Since January 2007, nine VCUs were approved, three following the issuance of a Notice of Hearing and one as a result of a Board Order.
- Airomir, 3M Canada Company
- Denavir, Barrier Therapeutics, Canada Inc. – May 2008
- Dovobet, LEO Pharma Inc.
- Forteo, Eli Lilly Canada Inc.
- Lantus, sanofi-aventis Canada Inc. – March 2008
- OctreoScan, Bristol-Myers Squibb Canada Co.
- Risperdal Consta, Janssen-Ortho Inc.
- Vaniqa, Barrier Therapeutics Canada Inc. – February 2008
- Zemplar, Abbott Laboratories Limited
Airomir is used for the treatment of asthma, chronic bronchitis, and other breathing disorders.
On May 14, 2007, the Hearing Panel approved a VCU agreed to by 3M Canada Company (3M Canada) and Board Staff, for the payment in full of revenues alleged by Board Staff to have been excessive, totaling $485,498.58, derived from January 1, 2004 to December 29, 2006. The proceeding into the price of Airomir, commenced by the issuance of a Notice of Hearing on February 20, 2006, was concluded with the approval of the VCU. 3M Canada met the terms of the VCU.
For purposes of the application of the Board´s Excessive Price Guidelines, Graceway Pharmaceuticals (Graceway) is the Canadian patentee of Airomir as of December 29, 2006. Under the Patented Medicines Regulations, Graceway is required to file pricing and sales information with the PMPRB twice a year, at regular intervals, as well as file its R&D expenditures annually.
Denavir is indicated for the treatment of recurrent herpes labialis (cold sores) in adults.
On May 20, 2008, the Chairperson of the Board approved a VCU submitted by Barrier Therapeutics Canada Inc. (Barrier) for the medicine Denavir.
Barrier undertook to reimburse the excess revenues accrued over the period of August 2006 to December 2007 in the amount of $61,021.80 by making a payment to the Government of Canada.
Dovobet is a dermatological drug required for bringing psoriasis under control.
On January 19, 2008, the Chairperson of the Board approved a VCU submitted by LEO Pharma Inc., for the medicine Dovobet. A Board Order issued on September 17, 2007, following a hearing, required LEO Pharma to price Dovobet at a non-excessive level, and to offset the excess revenues derived from the sale of Dovobet in Canada from 2002 through to December 2005. (For more information on the hearing in this matter, see the Hearings section of this report on page 18.)
For the period January 1, 2006 through December 31, 2006, Board Staff calculated the maximum non-excessive (MNE) price in accordance with the Board Order. In 2006, the average transaction price (ATP) of Dovobet exceeded the 2006 maximum non-excessive (MNE) price, resulting in excess revenues of $870,425.68. To offset these excess revenues, LEO Pharma submitted a VCU and made a payment in full to the Government of Canada.
Forteo is indicated for the treatment of postmenopausal women with severe osteoporosis who are at high risk of fracture or who have failed or are intolerant to previous osteoporosis therapy; and to increase bone mass in men with primary or hypogonadal severe osteoporosis who have failed or are intolerant to previous osteoporosis therapy.
On June 28, 2007, the Chairperson accepted a VCU for Forteo submitted by Eli Lilly Canada Inc. (Lilly).
The VCU included a reduction of the price of Forteo below the MNE price for 2007 in order to offset excess revenues. In the event that all excess revenues had not been offset by December 31, 2007, Lilly had undertaken to make a payment to the federal government in the amount of the remainder of the excess revenues that had not been offset. Excess revenues were offset by December 31, 2007.
Lantus (insulin glargine) is indicated for once-daily subcutaneous administration in the treatment of adult patients with Type 1 or Type 2 diabetes mellitus and pediatric patients (age 6-17 years) with Type 1 diabetes mellitus who require basal (long-acting) insulin for the control of hyperglycemia.
On March 14, 2008, the Chairperson of the Board approved a VCU submitted by sanofi-aventis Canada Inc. (sanofi-aventis) for the medicine Lantus.
In addition to reducing the price of Lantus to a non-excessive level, sanofi-aventis offset the cumulative excess revenues it received from sales of Lantus as of September 18, 2006 by making a payment to the Government of Canada in the amount of $694,239.50 and reducing the price of another medicine, ALTACE HCT. In the event that the full amount of excess revenues, totaling $3,969,554.83, has not been completely offset by December 31, 2008, sanofi-aventis has undertaken to make a further payment to the Government of Canada.
OctreoScan is a radiopharmaceutical agent used for the diagnosis of brain diseases and tumors.
On September 19, 2007, the Chairperson of the Board accepted a VCU for OctreoScan submitted by Bristol-Myers Squibb Medical Imaging, a Division of Bristol-Myers Squibb Canada Co. (Bristol-Myers Squibb).
In addition to reducing the price of OctreoScan to a non-excessive level, Bristol-Myers Squibb offset the excessive revenues accrued, in the amount of $387,181.87, by making payments to the hospitals that purchased OctreoScan and by making a payment to the Government of Canada for the remaining excess revenues in the amount of $7,439.82.
Risperdal Consta is a new formulation of an existing compound (risperidone) indicated for the management of the manifestations of schizophrenia and related psychotic disorders.
On June 7, 2007, the Hearing Panel approved a VCU agreed to by Janssen-Ortho Inc. and Board Staff to, among others, reduce the price of Risperdal Consta to a non-excessive level and to offset excess revenues in the amount of $4,386,172.99. By Order of the Board, the proceeding that was commenced with the issuance of a Notice of Hearing on January 30, 2006, was thereby concluded.
Janssen-Ortho Inc. met the terms of the VCU.
Vaniqa (eflornithine hydrochloride) is indicated for slowing of the growth of unwanted facial hair in women. It is recommended as an adjunct to any hair removal technique.
On February 28, 2008, the Chairperson of the Board approved a VCU submitted by Barrier Therapeutics Canada Inc., for the medicine Vaniqa.
Barrier reimbursed the excess revenues accrued over the period of November 2005 to December 2007, by making a payment to the Government of Canada, in the amount of $70,860.59.
Vaniqa is no longer sold in Canada.
Zemplar is indicated for the prevention and treatment of secondary hyperparathyroidism associated with chronic renal failure.
On September 26, 2007, the Hearing Panel approved a VCU agreed to by Abbott Laboratories Limited (Abbott) and Board Staff to ensure that, among others, the price of Zemplar IV is not excessive and to offset alleged excess revenues in the amount of $58,741.67.
The Chairperson had issued a Notice of Hearing on July 24, 2007, pertaining to the allegations of Board Staff that Zemplar IV had been, and was being, sold by Abbott at prices exceeding those indicated by the Board´s Excessive Price Guidelines. On September 17, 2007, the Hearing Panel received the above-mentioned VCU which proposed to resolve all issues raised by the Notice of Hearing.
By Order of the Board, the proceeding was thereby concluded. Abbott met the terms of the VCU.
The prices of these patented medicines are to remain within the Board´s Guidelines in all future periods in which they remain under its jurisdiction.
Hearings
The PMPRB´s regulatory mandate is to ensure that patentees´ prices of patented medicines are not excessive, thereby protecting consumer interests and contributing to Canadian health care.
In the event that the price of a patented medicine appears to be excessive, the Board can hold a public hearing and, if it finds that the price is excessive, it may issue an Order to reduce the price and to offset revenues received as a result of excessive prices. The Board´s decisions are subject to judicial review in the Federal Court of Canada (FC).
On January 1, 2007, there were eight ongoing hearings. The Board subsequently issued four Notices of Hearing into the matters of the medicines Zemplar, Penlac, and Quadracel-Pentacel, and into the matter of Apotex. It also initiated proceedings into the matter of Celgene Corporation and the medicine Thalomid with respect to its jurisdiction over the price of the medicine.
Of these 13 hearings, three were resolved by way of VCUs: Airomir, Riserpdal Consta and Zemplar. More details on these VCUs are available in the VCU section of this report. Board Orders, concluding the proceedings, were issued in the Dovobet and Copaxone matters. The Thalomid matter was also concluded when the Hearing Panel ruled that it has jurisdiction over the price of the medicine. At the time of publication of this Annual Report, seven matters remain before the Board.
Table 7 provides a summary of all matters before the Board in 2007 up to the publication of this report.
Table 7. Status of the Board´s Proceedings in 2007-2008
| In the matter of |
Indication |
Status |
|
Adderall XR
Shire Canada Inc.
(Formerly Shire BioChem Inc.)
|
Indicated for the treatment of Attention Deficit Hyperactivity Shire Canada Inc. Disorder(ADHD). |
The Board issued a Notice of Hearing in this matter on January 18, 2006. The Hearing Panel issued its decision on the merits on April 10, 2008. The Board is expected to issue an Order, concluding these proceedings in the coming weeks.
On December 15, 2006, the Hearing Panel issued a decision dismissing Shire´s motion for an order that the Board amend its Notice of Hearing to limit its inquiry to the period following the date of issuance of Shire´s patent 2,348,090, namely, April 13, 2004. Shire filed an application for judicial review with the FC. The FC issued its decision on December 19, 2007, dismissing the matter. Shire has appealed the FC decision. The Federal Court of Appeal has not yet heard the parties (i.e., Shire, Janssen-Ortho (intervener), and the Attorney General of Canada) on the appeal. |
Airomir
3M Canada Company |
Used for the treatment of asthma, chronic bronchitis, and other breathing disorders. |
The proceeding into the matter of 3M Canada Company and the price of Airomir, commenced by the issuance of a Notice of Hearing on February 20, 2006, was concluded with the approval of a VCU on May 14, 2007. For more information on this matter, see Voluntary Compliance Undertakings, on page 17. |
Apotex Inc.
(initiated in 2008) |
|
The Board issued a Notice of Hearing in the matter of Apotex Inc. on March 3, 2008, requiring information concerning its status as a patentee and the filing of all statutory information required of a patentee pursuant to the Patent Act and the Patented Medicines Regulations, 1994. The Hearing Panel is scheduled to hear this matter on October 6, 2008. |
Concerta
Janssen-Ortho Inc. |
Indicated for the treatment of Attention Deficit Hyperactivity Disorder (ADHD). |
The Board issued a Notice of Hearing in this matter on July 24, 2006. The Board´s decision in this matter is pending.
It is important to note that Janssen-Ortho was granted the status of intervener in the judicial review application launched by Shire with regard to the Board´s December 15, 2006 decision (Shire and the issue of pre-patent, as described under Adderall XR above). Janssen-Ortho has also appealed the December 19, 2007 FC decision dismissing the case.
|
Copaxone
Teva Neuroscience G.P.-S.E.N.C. |
Indicated for use in ambulatory patients with Relapsing-Remitting Multiple Sclerosis to reduce the frequency of relapses. |
The Board issued a Notice of Hearing into the matter of Copaxone on May 8, 2006. After hearing the parties, the Hearing Panel issued its decision and reasons in this matter on February 25, 2008, including instructions that the parties file a proposed Board Order. The Panel received
separate submissions on a proposed Board Order and issued its Order on May 12, 2008, and, having found that Copaxone had been sold at an excessive price, required Teva to reimburse $2,417,223.29 in excess revenues.
Teva Neuroscience has filed a Notice of Application with the FC seeking judicial review. A hearing date has not yet been scheduled. |
Dovobet
LEO Pharma Inc. |
A dermatological drug administered for bringing psoriasis under control. |
The Board issued a Notice of Hearing in the matter of LEO Pharma Inc. and the medicine Dovobet on November 29, 2004. This matter was concluded with the issuance of a Board Order on September 17, 2008, requiring LEO Pharma to price Dovobet at a non-excessive level, and to offset the excess revenues derived from the sale of Dovobet in Canada from 2002 through to December 2005. |
Nicoderm
Hoechst Marion Roussel Canada |
Indicated for smoking cessation |
The Board issued a Notice of Hearing in this matter in April 1999. Following proceedings before the FC, the matter was returned before the Board. The Hearing Panel will hear the parties on the resolution of this matter on July 3, 2008. |
Penlac
sanofi-aventis Canada Inc. |
Indicated as part of a comprehensive nail management program in immunocompetent patients with mild to moderate onychomycosis of fingernails and toenails without lunula involvement |
The Board issued a Notice of Hearing in this matter on March 26, 2007. Hearing sessions were initiated in June 2007. The Hearing Panel will complete the evidentiary portion of this hearing on July 14-15, 2008 and will hear final arguments on August 20. |
Quadracel and Pentacel
sanofi pasteur Limited |
Quadracel – indicated for the primary immunization of infants, at or above the age of 2 months, and as a booster in children up to their 7th birthday against diphtheria, tetanus, whooping cough (pertussis) and poliomyelitis.
Pentacel – indicated for the routine immunization of all children between 2 and 59 months of age against diphtheria, tetanus, whooping cough (pertussis), poliomyelitis and haemophilus influenzae type b disease. It is sold in Canada in the form of a reconstituted product for injection combining
one single dose vial of Act HIB (Lyophilized powder for injection) and one single (0.5 mL) dose ampoule of Quadracel (suspension for injection).
|
The Board issued a Notice of Hearing in this matter on March 27, 2007. Following the Hearing Panel´s decision of November 26, 2007 denying sanofi pasteur´s Motion that the Panel replace its counsel in this proceeding, sanofi pasteur filed a judicial review application with the FC. The application for judicial review was dismissed. The Panel will reconvene this hearing on June 13, 2008. |
Risperdal Consta
Janssen-Ortho Inc. |
A new formulation of an existing compound (risperidone) indicated for the management of the manifestations of schizophrenia and related psychotic disorders |
The Board issued a Notice of Hearing in the matter of Janssen-Ortho Inc. and the medicine Risperdal Consta on January 30, 2006. The matter was concluded on June 7, 2007, with the Hearing Panel´s approval of a VCU agreed to by Janssen-Ortho Inc. and Board Staff to, among others, reduce the price of Risperdal Consta to a non-excessive level and to offset excess revenues in the amount of $4,386,172.99. For more information on the VCU, see Voluntary Compliance Undertakings, on page 18. |
Strattera
Eli Lilly Canada Inc. |
Indicated for the treatment of Attention Deficit Hyperactivity Disorder (ADHD) in children 6 years of age and over, adolescents and adults. |
The Board issued a Notice of Hearing in this matter on December 15, 2006. Hearing dates have not yet been scheduled. |
Thalomid
Celgene Corporation |
Thalomid does not have a Notice of Compliance but patients in Canada have been purchasing Thalomid from Celgene since 1995 (through Health Canada´s Special Access Programme). Thalomid has been particularly successful in slowing the progress of multiple myeloma, a form of cancer. |
A Hearing Panel of the Board heard submissions from Celgene Corporation and Board Staff on the Board´s jurisdiction in the matter of the price of Thalomid as provided to Canadian patients under Health Canada´s Special Access Programme. In its decision of January 21, 2008, the Board ruled that it has jurisdiction over the price of Thalomid. Celgene Corporation filed a Notice of Application with the FC for a judicial review of the Panel´s decision. A hearing date has not yet been scheduled. |
Zemplar
Abbott Laboratories Limited |
Indicated for the prevention and treatment of secondary hyperparathyroidism associated with chronic renal failure. |
The Board issued a Notice of Hearing in this matter on July 24, 2007. The matter was concluded on September 26, 2007, with the approval of a VCU agreed to by Abbott Laboratories Limited and Board Staff to ensure that, among others, the price of Zemplar IV is not excessive and to offset alleged excess revenues in the amount of $58,741.67. For more information on the VCU, see Voluntary Compliance Undertakings, on page 18.
|
Reporting Information on Key Pharmaceutical Trends
- Trends in Sales of Patented Drugs
- Price Trends
- Comparison of Foreign Prices to Canadian Prices
- Utilization of Patented Drugs
- Manufacturing Trends in Canada
- Canadian Sales in The Global Context
- Analysis of Research and development Expenditure
Trends in Sales of Patented Drugs
Trends in Sales of Patented Drugs 9
Patentees are required, under the Patented Medicines Regulations (Regulations) to submit detailed information on their sales of patented drugs, including information on quantities sold and net revenues received for each product by class of customer in each province/territory. This information allows the PMPRB to analyze trends in sales, prices and utilization of patented drugs. Results of this analysis are presented in this section.10
Sales and Prices
Canadians spend much more today on drugs than they did a decade ago. However, it is important to understand that an increase in spending on drugs does not in itself imply rising drug prices. Previous Annual Reports have found little change in patented drug prices while sales growth was 10-20%. In these instances sales growth was driven by changes in the volume and composition of drug utilization.11 A variety of factors can produce such changes. These include:
- increases in total population;
- changes in the demographic composition of the population (e.g., shifts in the age-distribution toward older persons with more health problems);
- increased incidence of health problems requiring drug therapy;
- changes in the prescribing habits of physicians (e.g., shifts away from older, less expensive drugs to newer, more expensive medications);
- greater use of drug therapy instead of other forms of treatment; and,
- use of new drug products to treat conditions for which no effective treatment existed previously
Sales Trends
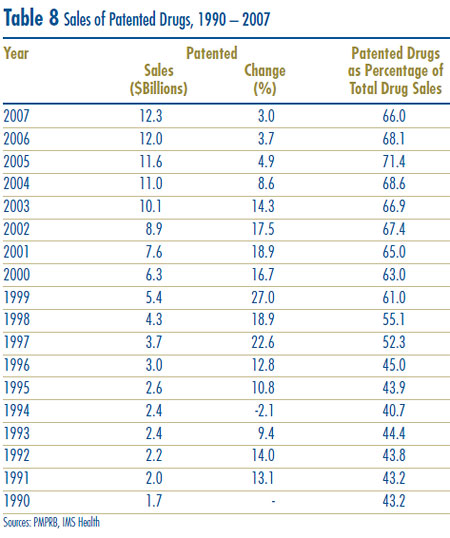
Table 8 reports patentees´ total sales of patented drugs in Canada for the years 1990 through 2007. Sales of patented drugs rose to $12.3 billion from $12.0 billion in 2006, an increase of 3.0%. By comparison, annual growth in sales of patented drugs stood at 27.0% in 1999 and remained in double-digits until 2003.
The fourth column of Table 8 gives sales of patented drugs as a share of overall drug sales. This share rose from approximately 43% in 1990 to 71.4% in 2005. It declined from 68.1% in 2006 to 66.0% in 2007, which implies that sales of generic and non-patented branded drug products grew at a considerably faster rate between these years than sales of patented drugs.12
Drivers of Expenditure Growth
Table 9 decomposes the sales growth that occurred between 2006 and 2007 into distinct elements reflecting the impacts of:
- previously patented drugs that have gone off-patent or left the Canadian market (“Exiting Drug Effect”);
- patented drugs introduced to the Canadian market in 2007 (“New Drug Effect”);
- changes in prices among patented drugs that had Canadian sales in both 2006 and 2007 (“Price Effect”);
- differences in the quantities of such drugs sold in the two years (“Volume Effect”); and
- interactions of price and quantity changes (“Cross Effect”).
The first row of Table 9 gives these impacts as dollar amounts. The second row expresses the impacts as proportions of the change in sales between 2006 and 2007. For the sake of comparison, the third row provides year-over-year proportionate impacts averaged over the period 2002 through 2006.13
The results in this table show that the increase in sales that occurred between 2006 and 2007 was mostly the result of underlying increases in the quantities of patented drugs sold. The resulting volume effect was large enough to more than compensate for a relatively large (negative) exiting drug effect. The contribution of the new drugs in augmenting sales was less than a third that of the volume effect.14 Finally, the overall impact of price changes on sales was negative, but very small in magnitude.
Results obtained for 2007 are typical. The averaged proportionate impacts for 2002 – 2006 imply that year-over-year sales growth has been driven mostly by rising utilization. In comparison, the impact of price changes has been negligible.
The pronounced decline in sales growth of the last few years is a striking development. Last year´s Annual Report argued that throughout the 1990´s sales growth was largely driven by a succession of new “blockbuster” products that ultimately achieved very high sales volumes, and that since the beginning of the current decade the pharmaceutical industry had not introduced new high-volume products in sufficient numbers to sustain the double-digit sales growth seen in the 1990´s. As a result, 2006 sales of patented drugs were still dominated by products introduced between 1995 and 1999.
These patterns appear once again in 2007 sales. Figure 4 breaks down patentees´ 2007 sales by the year in which products were first sold in Canada. The results in Figure 4 clearly demonstrate that sales of patented drugs are still dominated by products introduced in the second half of the 1990´s: in 2007 products introduced before 2000 accounted for sales of $7.0 billion, compared to $5.4 billion for products introduced in 2000 or later. Patented drugs introduced to Canada in 1997 still account for by far the largest component of 2007 sales.
Table 9 Decomposition of Changes in Sales
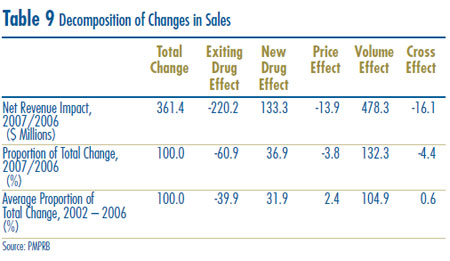
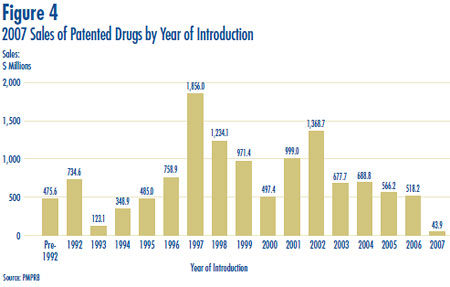
figure 4
Sales by Therapeutic Class
The PMPRB normally classifies drugs according to the World Health Organization´s (WHO) Anatomical Therapeutic Chemical (ATC) system when it conducts analyses at the level of therapeutic class. This is a hierarchical system that classifies drugs according to their principal therapeutic use and chemical composition. At its most aggregate level, Level 1, the ATC system classifies drugs according to the aspect of human anatomy with which they are primarily associated.
Table 10 breaks out sales of patented drugs in Canada in 2007 by major therapeutic class, defined by ATC Level 1. The table gives the 2007 sales for each class, the share of the total sales this represents and the rate at which sales grew relative to 2006. Values in the last column represent the component of overall sales growth attributable to drugs in the corresponding therapeutic class.15 By this measure, the primary drivers of sales growth between 2006 and 2007 were:
- drugs treating the respiratory system and
- antineoplastics and immunomodulating agents.
These two classes jointly accounted for more that 80% of sales growth. This is the third consecutive year antineoplastics and immunomodulating agents have emerged as a leading contributor to sales growth.
Table 10 Patentees´ Sales of Patented Drugs by Therapeutic Class
| Therapeutic Class |
Sales 2007 ($M) |
Share of Total 2007 Sales (%) |
Growth: 2007/2006 ($M) (%) |
Share of Sales Growth (%) |
| A: Alimentary Tract and Metabolism |
1,602.1 |
13.0 |
39.3 |
2.5 |
10.9 |
| B: Blood and Blood Forming Organs |
883.7 |
7.2 |
86.0 |
10.8 |
23.8 |
| C: Cardiovascular System |
3,105.3 |
25.1 |
41.7 |
1.4 |
11.5 |
| D: Dermatologicals |
126.8 |
1.0 |
27.2 |
27.3 |
7.5 |
| G: Genito-urinary System and Sex Hormones |
417.1 |
3.4 |
36.6 |
9.6 |
10.1 |
| H: Systemic Hormonal Preparations |
95.4 |
0.8 |
-7.4 |
-7.2 |
-2.0 |
| J: General Antiinfectives for Systemic Use; and P: Antiparasitic Products16 |
1,175.7 |
9.5 |
39.3 |
3.5 |
10.9 |
| L: Antineoplastics and Immunomodulating Agents |
1,677.6 |
13.6 |
120.1 |
7.7 |
33.2 |
| M: Musculo-skeletal System |
495.0 |
4.0 |
29.0 |
6.2 |
8.0 |
| N: Nervous System |
1,600.5 |
13.0 |
-202.1 |
-11.2 |
-55.9 |
| R: Respiratory System |
947.7 |
7.7 |
132.5 |
16.3 |
36.7 |
| S: Sensory Organs |
161.1 |
1.3 |
12.1 |
8.1 |
3.4 |
| V: Various |
59.3 |
0.5 |
7.1 |
13.6 |
2.0 |
| All Therapeutic Classes |
12,347.4 |
100.0* |
361.5 |
3.0 |
100.0* |
Source: PMPRB
* Values in this column may not add to 100.0 due to rounding.
9 Throughout this chapter the term “patented drug” denotes products currently subject to the PMPRB price review.
10 All statistical results for 2007 are based on data submitted by patentees as of March 2008. On occasion, patentees report revisions to previously submitted data or provide data not previously submitted. New data of this sort can appreciably affect the statistics on which this chapter reports. To account for this possibility, the PMPRB has adopted the practice of reporting recalculated sales figures (Trends in Sales of Patented Drugs), price and quantity indices (Price Trends, on page 27; Utilization of Patented Drugs, on page 36) and foreign-to-Canadian price ratios (Comparison of Canadian Prices to Foreign Prices, on page 32) for the five years preceding the current Annual Report year. All such recalculated values reflect currently available data. Consequently, where data revisions have occurred, values reported here may differ from those presented in earlier Annual Reports.
11 Studies conducted by the PMPRB of public pharmaceutical insurance plans indicate that increased utilization of existing and new drugs accounts for most of the recent growth in expenditures. PMPRB, Provincial Drug Plan Overview Report: Pharmaceutical Trends, 1995/96 -1999/00, September 2001.
12 The denominator in this ratio comprises sales of patented drugs, generic drugs and non-patented branded drugs. Starting with the estimate for 2006 the ratio is based on data provided in IMS Health´s periodical report Canadian Pharmaceutical Market: Drug Store and Hospital Purchases. In previous years IMS data was used to calculate generic sales only, while sales of non-patented branded products were estimated from data submitted by patentees. Because of anomalies in this latter estimate (due to year-to-year changes in the set of patentees), the PMPRB now uses IMS´ estimate of total drug sales to calculate this ratio. It should be noted that the decline in the ratio between 2005 and 2006 is partly a result of this change in methodology.
13 Under the scheme applied here, the “exiting drug effect” is the amount of 2006 sales generated by drugs that were under the PMPRB´s jurisdiction in 2006 but not in 2007. The “new drug effect” is the amount of 2007 sales generated by drugs that were under the PMPRB´s jurisdiction in 2007 but not in 2006. Other effects are derived by means of the relationship:
| Ó p2007(i) q2007(i) - Ó p2006(i) q2006(i) |
= Ó [p2007(i) - p2006(i)] q2006(i) |
|
+ Ó p2006(i) [q2007(i) - q2006(i)] |
|
+ Ó [p2007(i) - p2006(i)] [q2007(i) - q2006(i)] |
where py(i) is the price of drug “I” in year “y”, qy(i) is the physical volume of drug “I” sold in year “y” and Ó signifies summation over the set of drugs that were under the PMPRB´s jurisdiction in both 2006 and 2007. The left-hand-side in this equation represents the change in total sales of such drugs between 2006 and 2007. The three terms of the right-hand-side respectively define the volume, price and cross effects reported in Table 9.
14 As indicated above, the “new drug effect” is limited to the year in which a new patented drug is introduced to Canada. At least part of the “volume effect” will occur because of (what may be) the rapid therapeutic uptake of new drugs in the years immediately following their introduction.
15 This is obtained as the ratio of the year-over-year change in the dollar value of sales for the therapeutic class in question to the change in sales for all patented drugs.
16 These groups have been combined for reasons of confidentiality.
Price Trends
The PMPRB uses the Patented Medicine Price Index (PMPI) to monitor trends in prices of patented drugs. The PMPI is a price index measuring the average year-over-year change in the ex-factory prices of patented drugs sold in Canada. The index is constructed using a chained Laspeyres price index formula that takes a sales-weighted average of price changes observed at the level of individual drugs.17 This is similar to the approach Statistics Canada uses to construct the Consumer Price Index (CPI). The PMPI is updated every sixmonths using price and sales information submitted by patentees.18
It is important to understand the conceptual relationship between the PMPI and drug costs. The PMPI does not measure changes in the utilization of patented drugs: a quantity index, the PMQI, is calculated for this purpose (see Utilization of Patented Drugs, on page 36). The PMPI does not measure the cost-impact of changes in prescribing patterns or the introduction of new medicines. By design, the PMPI isolates the component of sales growth attributable to changes in the prices of patented drugs.
Figure 5 provides year-over-year changes in the PMPI for the years 1988 through 2007. As measured by the PMPI, prices of patented drugs declined on average by 0.1% between 2006 and 2007. Note that a small overall decline in prices is exactly what one would expect from the direction and relative size of the “price effect” cited in Table 9, on page 25.
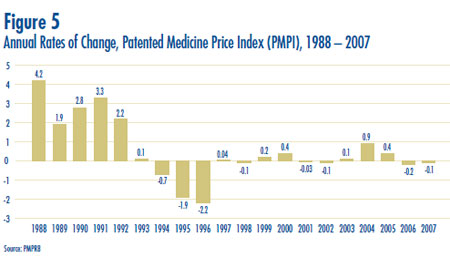
Comparison of PMPI and CPI
The Patent Act (Act) provides that, among other factors, the PMPRB shall consider changes in the CPI in determining whether the price of a patented drug is excessive. Figure 6 plots year-over-year rates of change in the PMPI against corresponding changes in the CPI. Inflation, as measured by the CPI, has exceeded the average increase in patented drug prices almost every year since 1988.19 This pattern continued in 2007, with the CPI rising by 2.1%20 as the PMPI fell by 0.1%.
That the PMPI has not kept pace with the CPI is not surprising. The Board´s Guidelines allow the price of a patented drug to rise by no more than the CPI over any three-year period. (The Guidelines also impose a cap on year-over-year price increases equal to one-and-one-half times the current year rate of CPI-inflation.) This effectively establishes CPI-inflation as an upper bound on the rate at which the PMPI may rise over any period of three years.21 Increases in the PMPI normally do not reach this upper bound because many patentees do not raise their prices by the full amount permitted under the Guidelines or reduce their prices.
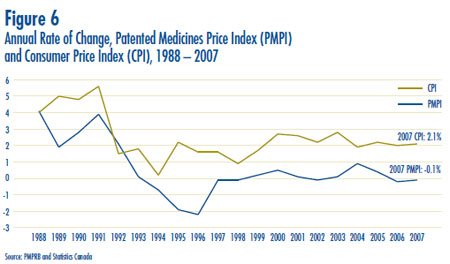
Price Change by Therapeutic Class
Table 11 provides average rates of price change among patented drugs at the level of major therapeutic classes. Results in this Table were obtained by applying the PMPI methodology to data segregated by their ATC Level I class. The last column provides a decomposition of overall PMPI change, with each entry representing the component of the overall change attributable to drugs in the corresponding therapeutic class. By this measure, drugs treating blood and bloodforming organs were the largest contributor (in absolute magnitude) to overall price change in 2007.22
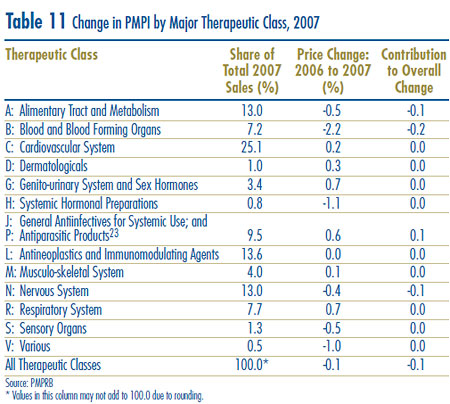
Price Change by Class of Customer
Figure 7 presents average rates of price change by class of customer. These results were obtained by applying the PMPI methodology to data on sales of patented drugs made specifically to hospitals, to pharmacies and to wholesalers.24 Rates of 2006-to-2007 price change ranged from -2.9% for sales to hospitals to 0.5 % for direct sales to pharmacies. Not surprisingly, the rate of price change for sales to wholesalers (which accounts for about three-quarters of all sales) is closest to the overall change in the PMPI. Note that in all customer classes rates of price change were substantially less than CPI-inflation.
It is clear from Figure 7 that the slight decline in the overall PMPI was the result of falling prices paid by hospital customers: a PMPI covering only sales to pharmacies and wholesalers would have risen by approximately 0.3% between 2006 and 2007.
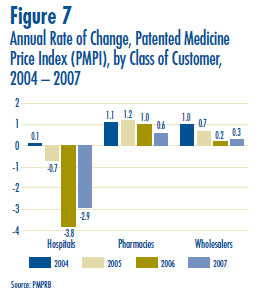
Price Change by Province/ Territory
Figure 8 presents average rates of price change by province/territory. These results were obtained by applying the PMPI methodology to data segregated by the province/territory in which the sale took place. Rates of price change range from -1.2% in the Yukon to 0.7% in Saskatchewan. Average price increases in five of the twelve provincial/territorial jurisdictions were offset by the modest decline in Ontario, resulting in the average national price decrease of 0.1%. Note that in all jurisdictions average rates of price change were well below CPI-inflation.
Figure 8 Annual Rate of Price Change, by Province/Territory: 2004, 2005, 2006 and 2007
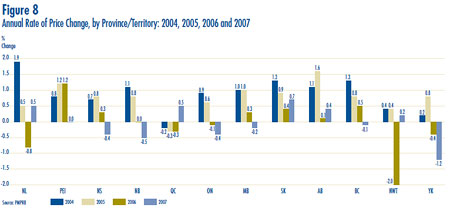
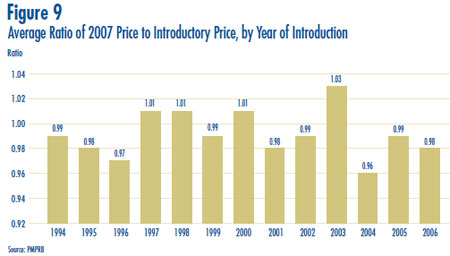
Price Behaviour after Introduction
Does the price of a typical patented drug change much in the years after it enters the Canadian market? To answer this question Figure 9 provides the average ratio of 2007 price to introductory price, that is, the price at which the drug was sold in its first year on the Canadian market. The Figure provides a separate average ratio for drugs introduced in 1993, those introduced in 1994 and so forth.
These results imply a remarkable degree of price stability: the 2007 price of a typical patented drug was within five percent of its introductory price, regardless of when it was introduced to Canada. The results also show no tendency for prices to rise or fall after introduction, tracing out an apparently random pattern around parity.25
Price Change by Country
In accordance with the Act and the Regulations, patentees must report publicly available ex-factory prices of patented drugs in seven foreign countries. These countries are: France, Germany, Italy, Sweden, Switzerland, the United Kingdom and the United States. The PMPRB uses this information:
- to conduct the international price comparison tests specified in the Guidelines; and
- to compare the Canadian prices of patented drugs with those in other countries.
Figure 10 gives average annual rates of price change for Canada and each of the seven comparator countries. These results were obtained by applying the PMPI methodology (with weights based on Canadian sales patterns) to international price data submitted to the PMPRB. Note that two results are presented for the U.S. The first of these is restricted to published U.S. “market” prices, typically wholesale acquisition costs26, submitted by patentees. The second incorporates prices from the U.S. Federal Supply Schedule (FSS), also submitted by patentees.27
Five of seven comparator countries registered overall price increases between 2006 and 2007, the exceptions being France and Switzerland. Switzerland saw the largest average decline (-0.9%). In contrast, U.S. prices rose by nearly 6%.
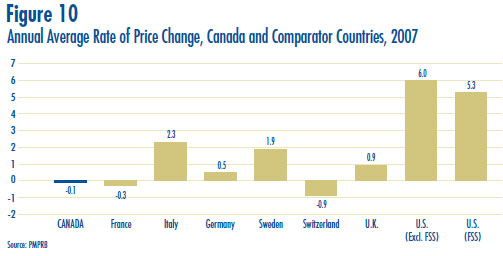
17 More exactly, at the level defined by Health Canada´s Drug Identification Number (DIN). Each DIN represents a unique combination of active ingredient(s), dosage form and strength(s).
18 See the PMPRB´s A description of the Laspeyres methodology used to construct the Patented Medicine Price Index (PMPI), June 2000, for a detailed explanation of the PMPI. Restricting the PMPI to products for human use began in 1999.
19 1992 is the only year in which the PMPI rose at a faster rate than the CPI. To facilitate and encourage compliance by patentees, the PMPRB´s CPI-adjusted methodology uses the forecast rate of CPI inflation published by the Department of Finance. The forecast CPI inflation rate for 1992 was 3.2%, whereas the actual rate was 1.5%. For a full explanation of the CPI-adjusted methodology, please refer to Schedule 4 of the PMPRB´s Compendium of Guidelines, Policies and Procedures.
20 Statistics Canada, CANSIM, Series V735319.
21 In theory, the one-year increase cap allows the PMPI to rise at a faster rate than CPI in any given year.
22 Suppose R represents the overall rate of change in the PMPI. Suppose there are N therapeutic classes, indexed by 1, 2 … N. Let R(i) represent the average rate of price change in major therapeutic class i obtained by means of the PMPI methodology. Using the fact that R is a sales-weighted average of price changes taken over all patented drugs, it is easy to derive the following relationship: R = w(1)R(1) + w(2)R(2) + … + w(N)R(N), where w(i) represents the share of therapeutic class i in the sales of patented drugs. This relationship provides the basis for the decomposition in the last column of Table 11. Each term on its right-hand side multiplies the average rate of price change for a given therapeutic class by its share of overall sales. The resulting value is readily interpreted as the corresponding class´ contribution to the change in the overall PMPI. Note that the size of this contribution depends on both the rate of price change specific to the class and its relative importance (measured by its share of sales).
As noted in the text, the decomposition in Table 11 is approximate. This is because the weights used to calculate the contribution of each therapeutic class are based on annual sales data, whereas the rate of price change – whether overall or by therapeutic class – is calculated from data covering periods of six months. The resulting discrepancy is normally very small
23 These groups have been combined for reasons of confidentiality.
24 Results for a fourth customer class, “Others”, are not provided. Buyers in this class are principally healthcare institutions other than hospitals, such as clinics and nursing homes. This class accounted for about 5% of patented drug sales in 2007.
25 It must be emphasized that this statement refers to the behaviour of prices on average. There are undoubtedly instances where individual prices have risen or fallen substantially since introduction.
26 The term “wholesale acquisition cost” (WAC) refers to the price paid by a wholesaler to the supplier, usually the drug´s manufacturer. A publicly disclosed WAC is typically a manufacturer´s list price and, as such, may not reflect all discounts provided by the manufacturer.
27 The pharmaceutical industry in the U.S. has argued that the publicly available prices in that country do not reflect actual prices because of confidential discounts and rebates. Effective January 2000, and following public consultation, the PMPRB began including prices listed in the U.S. Federal Supply Schedule (FSS) in calculating the average U.S. price of patented drugs. The FSS prices are negotiated between manufacturers and the U.S. Department of Veterans´ Affairs. They are typically less than other publicly available U.S. prices reported to the PMPRB by patentees.
Comparison of Canadian Prices to Foreign Prices
Tables 12 and 13, on pages 33 and 34, provide detailed statistics comparing the foreign prices of patented drugs to their Canadian prices. Each Table provides four sets of average price ratios. These are differentiated according to (1) the averaging formula applied and (2) the method by which foreign prices were converted to their Canadian dollar equivalents. The Tables also give the numbers of drugs (DINs) and the volume of sales encompassed by each reported statistic.28
The PMPRB has traditionally reported average foreign-to-Canadian price ratios constructed as sales-weighted geometric means of individual ratios. Such results are included in Tables 12 and 13 (under the label “Geometric Mean”). The Tables also provide results obtained using a salesweighted arithmetic average (under the label “Arithmetic Mean).29 These latter statistics provide an exact answer to questions of the type:
“How much more/less would Canadians have paid for the patented drugs they purchased in 2007 had they paid Country X prices rather than Canadian prices for these products?” For example, Table 12 states that the 2007 average French-to-Canadian price ratio obtained using the arithmetic mean is 0.90. This means Canadians would have paid 10% less for the patented drugs they purchased in 2007 had they been able to buy these products at French prices.
For many years the PMPRB has reported average foreign-to-Canadian price ratios with foreign prices converted to their Canadian dollar equivalents by means of market exchange rates (more exactly, the 36-month moving-averages of market rates the PMPRB normally uses in applying its Price Review Guidelines). Last year, the PMPRB began also reporting foreign-to-Canadian price ratios with currency conversion at purchasing power parity (PPP). The PPP between any two countries measures their relative cost-of-living expressed in their own currencies. In practice, cost-of-living is determined by pricing out a standard set (or “basket”) of goods and services at prices prevailing in each country. Because PPPs are designed to represent relative cost-of-living, they offer a simple way to account for differences in national price levels when comparing individual prices, incomes and other monetary values across countries. When applied to the calculation of average foreign-to-Canadian price ratios, they produce statistics answering questions of the form:
“How much more/less consumption of other goods-and-services would Canadians have sacrificed for the patented drugs they purchased in 2007 had they lived in Country X?” Questions of this type cannot be answered by simply comparing drug prices. Rather, one must first calculate what each price represents in terms of goods and services foregone. PPPs are designed for such purposes.
Bilateral Comparisons
Table 12 provides bilateral comparisons of prices in each of the PMPRB´s seven comparator countries to corresponding Canadian prices. Focusing on the results with currency conversion at market exchange rates (and calculated as a geometric mean), it appears that Canada is slightly above with regard to the prices of patented drugs. Prices in Italy and France are, on average, appreciably less than Canadian prices, while prices in the U.S. are higher. As in previous years, 2007 U.S. prices were substantially higher than prices in Canada or any other comparator country.
Figure 11 puts these results in historical perspective. In 1987, Canadian prices were, on average, below U.S. prices but above those in all other countries. By the mid-1990´s the situation had changed dramatically, with Canadian prices in the mid-range of the six European countries. In 2007, Canadian prices were again second only to the U.S.
It should be noted that the average price ratios obtained with currency conversion at PPPs tell a very different story. Once one accounts for international differences in cost of living, Canada emerges as an even higher cost country. It appears Canadians incurred a substantially greater consumption cost for the patented drugs they purchased in 2007 than did residents of every comparator country other than the U.S.
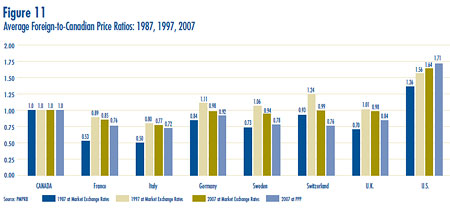
Table 12 Average Foreign-to-Canadian Price Ratios, Bilateral Comparisons, 2007
| (i) At Market Exchange Rates |
|
Can |
Fra |
Ita |
Ger |
Swe |
Swi |
U.K. |
U.S. |
| Geometric Mean |
1.00 |
0.85 |
0.77 |
0.98 |
0.94 |
0.99 |
0.98 |
1.64 |
| Arithmetic Mean |
1.00 |
0.90 |
0.82 |
1.07 |
0.99 |
1.06 |
1.03 |
1.76 |
| Number of DINs |
1,145 |
748 |
744 |
840 |
816 |
797 |
835 |
985 |
| Net Revenues ($Millions) |
12,3437 |
10,620 |
10,399 |
10,711 |
10,843 |
11,101 |
11,179 |
11,4790 |
| (ii) At Purchasing Power Parities |
|
Can |
Fra |
Ita |
Ger |
Swe |
Swi |
U.K. |
U.S. |
| Geometric Mean |
1.00 |
0.76 |
0.72 |
0.92 |
0.78 |
0.76 |
0.84 |
1.71 |
| Arithmetic Mean |
1.00 |
0.81 |
0.78 |
1.00 |
0.82 |
0.82 |
0.88 |
1.85 |
| Number of DINs |
1,145 |
748 |
744 |
840 |
816 |
797 |
835 |
985 |
| Net Revenues ($Millions) |
12,3437 |
10,620 |
10,399 |
10,711 |
10,843 |
11,101 |
11,179 |
11,4790 |
Multilateral Price Comparisons
Table 13 provides average Foreign-to-Canadian price ratios using several multilateral measures of foreign prices. The “median international price” (MIP) is calculated as a median of prices observed in the seven comparator countries. Other multilateral price ratios compare the minimum, maximum and simple mean of foreign prices to their Canadian counterparts.
Focusing again on results at market exchange rates (and obtained using the geometric mean), the average MIP-to-Canadian price ratio stood at 0.98 in 2007. By this measure, MIPs were on average slightly less than corresponding Canadian prices. Last year´s Annual Report gave a value of 1.01 for 2006, indicating MIPs were slightly higher than Canadian prices.
Figure 12 puts this result in historical perspective. MIPs were on average 19% less than corresponding Canadian prices in 1987. By 1998, MIPs were on average 14% higher than Canadian prices. The average MIP-to-Canadian price ratio had remained above parity until 2007.
Results obtained with other multilateral measures are much as one would expect. Interestingly, it appears mean foreign prices typically produce higher Foreign-to-Canadian price ratios than do MIPs. This is readily explained by the influence of U.S. prices, which are typically much higher than prices elsewhere. U.S. prices nearly always figure importantly in the calculation of the mean foreign price but seldom serve as median international prices.
As with the bilateral comparisons, differences between results obtained at market exchange rates and at PPPs are striking. These affirm the claim that while Canada may be a “medium-price” country in purely monetary terms, Canadians actually sacrifice appreciably more consumption to acquire patented drugs than do residents of most comparator countries. With currency conversion at PPPs, the average MIP-to-Canadian price ratio (calculated as a geometric mean) was 0.85 in 2007, substantially less than the value of 0.98 obtained at market exchange rates.
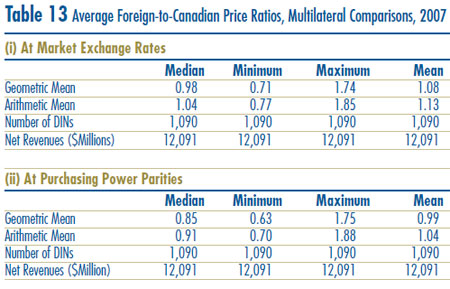
Figure 13 offers more detail on the product level MIP-to-Canadian ratios underlying the averages reported in Table 13. This Figure distributes 2007 sales of patented drugs according to the value of its MIP-to-Canadian price ratio (more exactly, according to the range into which that ratio fell).30 The Figure indicates that product-level price ratios were heavily concentrated around parity: cases where the MIP-to-Canadian price ratio was between 0.75 and 1.25 accounted for 72.4% of Canadian sales. Instances where the MIP was less than 75% of the Canadian price accounted for only 12% of sales, while instances where the MIP exceeded the Canadian price by more than 25% accounted for the remaining 15.6% of sales.
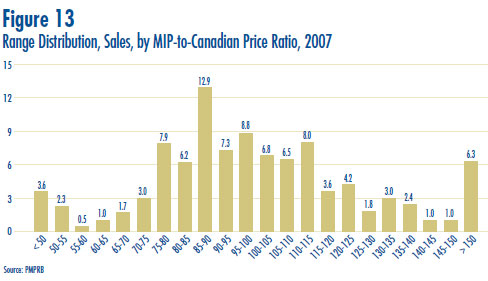
Average Price Ratios: Analysis of Changes
Recall that Figure 12, on page 34, indicates that a decline in the average MIP-to-Canadian price ratio occurred between 2006 and 2007. In light of the method used to derive the average ratio, there are four factors that might account for this decline:
- appreciation of the Canadian dollar against other currencies (which will tend to reduce the Canadian-dollar equivalents of foreign prices);
- declining foreign prices;
- rising Canadian prices; and
- a shift in sales-weights favouring drugs with relatively low MIP-to-Canadian price ratios.
Further data analysis reveals that the decline in the average MIP-to-Canadian price ratio is almost entirely the result of recent appreciation of the Canadian dollar against other currencies. Using 2006 exchange rates instead of 2007 rates yields a MIP-to-Canadian average price ratio of 1.01, precisely the value given in last year´s Annual Report.31 In contrast, replacing the 2007 values of other inputs with 2006 values has little impact on the average price ratio.
28 The number of drugs and sales encompassed vary from comparator to comparator because it is not always possible to find a matching foreign price for every patented drug product sold in Canada. It is worth noting in this regard that all of the average price ratios reported in Tables 12 and 13 cover at least 84% of 2007 Canadian sales. The reported US-to-Canada price ratios cover about 93% of 2007 sales.
29 Let RG represent the average price ratio obtained using the geometric method, RA the average price ratio obtained using the arithmetic method. Let p(i) represent the Canadian price of drug i, pf(i) its foreign price (converted to Canadian dollars) and w(i) its share of Canadian sales. Then RG = Ð [pf(i)/p(i)]w(i) (where Ð signifies multiplication over all patented drugs), while RA = Ó w(i)[pf(i)/p(i)] (where Ó signifies summation over all patented drugs).
It is readily demonstrated that RG can never exceed RA. It is also possible to show that the difference between RA and RG will increase with the extent of variation among individual price ratios, and that RG will equal RA only in the special case where all product-level price ratios have the same value.
30 To produce the results in this Figure, foreign prices were converted to their Canadian dollar equivalents using market exchange rates.
31 It should be noted that recent appreciations of the Canadian dollar are yet to be fully reflected in the PMPRB´s currency conversion factors. These factors are calculated as simple 36-month moving averages of market exchange rates. This means that a long-term change in the value of a particular exchange rate will not be fully reflected in the corresponding conversion factor until three years after the change has occurred.
Utilization of Patented Drugs
The price and sales data used to calculate the PMPI also allow the PMPRB to examine trends in the quantities of patented drugs sold in Canada. The PMPRB maintains the Patented Medicine Quantity Index (PMQI) for this purpose.32 Figure 14 displays average rates of utilization growth, as measured by the PMQI, from 1988 through 2007. These results confirm that growth in the utilization of patented drugs has been the primary source of rising sales, with rates of utilization growth roughly tracking rates of sales growth in recent years. This pattern continued in 2007, with utilization of patented drugs growing by 3.5%. Note that a rate of utilization growth somewhat exceeding sales growth is exactly what one would expect from the direction and relative size of the volume effect cited in Table 9, on page 25.
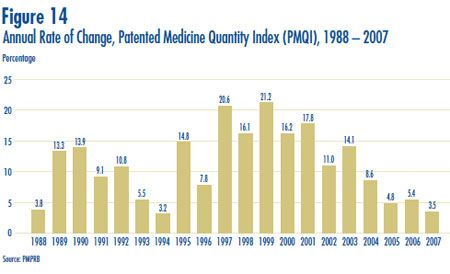
Utilization Growth by Therapeutic Class
Table 14 provides average rates of utilization growth among patented drugs at the level of major therapeutic classes. The results in this Table were obtained by applying the PMQI methodology to data segregated by ATC Level I class. As in Table 11, on page 29, the last column provides an approximate decomposition of overall PMQI change into contributions attributable to each therapeutic class. The largest entries in this column identify the primary drivers of quantity change.33 In 2007 these were:
- antineoplastics and immunomodulating agents; and
- drugs treating the respiratory system.
These two classes jointly accounted for more than two-thirds of the overall increase in utilization indicated by the PMQI.
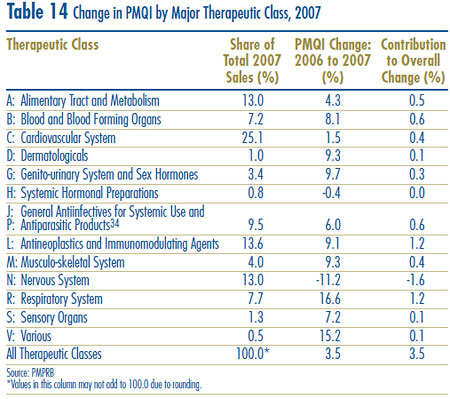
32 Like the PMPI, the PMQI is calculated using a chained Laspeyres index formula, with ratios of physical quantities in successive periods replacing the price ratios of the PMPI. Here again, the index is obtained as a revenue-weighted average of ratios at the level of individual products. Since the PMQI covers only patented drugs it should not be taken to represent utilization trends in the entire pharmaceutical market.
33 As in the case of Table 11, on page 29, this decomposition is only approximate. See Footnote 22, on page 28.
34 These groups have been combined for reasons of confidentiality.
Manufacturing Trends in Canada
The global pharmaceutical industry is dominated by a number of large multinational enterprises based in countries other than Canada. Most of
these companies have Canadian subsidiaries which, along with a few Canadian-based manufacturers, account for the manufacture, sale and distribution
of drugs in Canada.
According to Statistics Canada, shipments by Canadian drug manufacturers amounted to $9.6 billion in 2007, accounting for 1.7% of total shipments in the manufacturing sector.35 The sector employed 28,914 persons, accounting for 1.4% of total employment in manufacturing.36
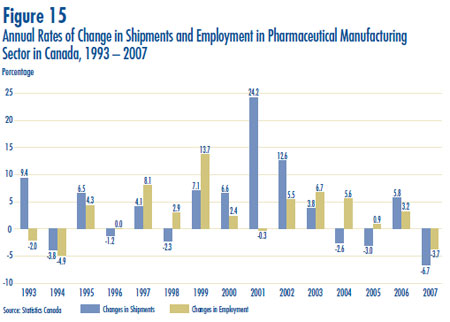
35 Since the PMPRB Annual Report 2005, Statistics Canada has re-benched the manufacturing shipments data from the 2002 Annual Survey of Manufacturing to the 2004 Annual Survey of Manufacturing. The re-benching process recast pharmaceutical and medicine manufacturing shipments significantly below previous estimates.
36 Statistics Canada, CANSIM, Series V800188 and V1709627
Canadian Sales in The Global Context
IMS Health regularly reports on patentees´ sales to the retail sector across a wide range of countries. IMS reports that in 2007 such sales amounted to $450.3 billion among major markets.37 Figure 16 shows how this amount was distributed among these markets. Drug sales in Canada accounted for 3.8 percent of total major market sales, a share comparable to that of Italy. The U.S. market is by far the largest, with drug sales exceeding the combined sales of all other major markets.
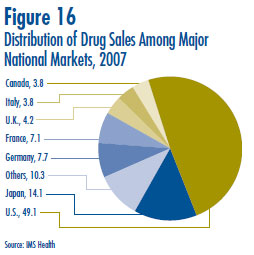
Figure 17 gives Canada´s share of major-market sales for each of the years 2001 through 2007.38 This share has risen from 2.4% in 2001 to 3.8% in 2007.
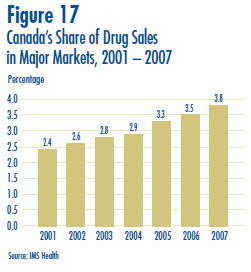
Figure 18 compares sales growth in Canada to that in other major markets. In recent years pharmaceutical sales have grown at a faster rate in Canada than elsewhere. This pattern continued in 2007, with year-over-year sales growth in Canada (6%)39 ahead of growth in other major markets (3%).
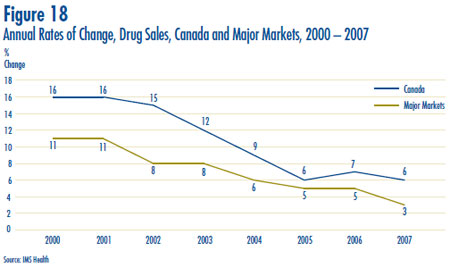
Figure 19 gives rates of 2007-over-2006 sales growth for individual major markets. Based on IMS data, Canadian sales growth exceeded growth observed in all other comparator countries including the U.S.
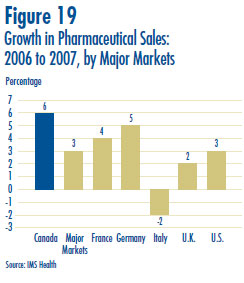
The proportion of national income allocated to the purchase of pharmaceuticals provides another way to compare drug costs across countries.40 Figure 20 gives drug expenditures as a share of Gross Domestic Product (GDP) for Canada and the seven comparator countries, based on data for 2005. Drug expenditures absorbed between 1.1% and 1.9% of GDP in the seven comparators countries. Canada lies near the upper end of this range.
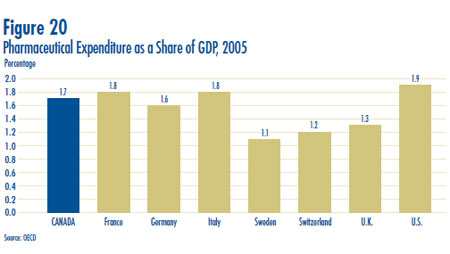
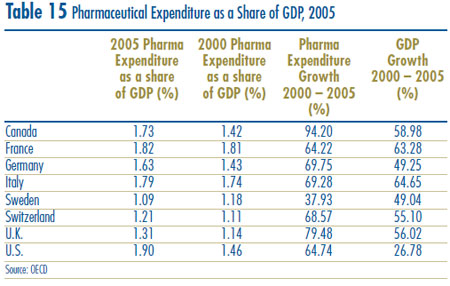
The share of national income absorbed by pharmaceutical expenditures has risen in most developed countries in recent years. Table 15 shows that, except for Sweden, pharmaceutical expenditures grew faster than GDP between 2000 and 2005 in Canada and each of the comparator countries. The results for Canada and the U.S. are especially striking: in both countries pharmaceutical expenditures grew at roughly twice the rate of national income.
Composition of Expenditures
Table 16 gives the composition of patentees´ sales by therapeutic class for Canada and six of the comparator countries.41 With only a few exceptions, these results imply a remarkable degree of uniformity. In almost all countries sales are dominated by cardiovascular and central nervous system products, which account for 35% to 47% of sales. The next two leading classes - products treating the alimentary tract and products treating the respiratory system - account for a further 21% to 28% of sales.
Table 16 Sales by Therapeutic Class, Canada and Comparator Countries, 2006
| Therapeutic Class |
Canada |
Foreign Average |
France |
Germany |
Italy |
Switz. |
U.K. |
U.S. |
| A: Alimentary Tract and Metabolism |
14.7 |
13.8 |
12.7 |
14.0 |
13.8 |
14.9 |
13.6 |
13.7 |
| B: Blood and Blood Forming Organs |
3.1 |
4.3 |
7.2 |
5.2 |
2.9 |
3.9 |
3.8 |
3.0 |
| C: Cardiovascular System |
27.2 |
21.2 |
20.9 |
15.8 |
30.9 |
20.0 |
22.3 |
17.1 |
| D: Dermatologicals |
2.7 |
2.5 |
1.9 |
2.1 |
2.7 |
3.3 |
2.7 |
2.5 |
| G: Genito-urinary System and Sex Hormones |
4.6 |
5.6 |
4.4 |
5.2 |
6.6 |
6.0 |
5.3 |
6.0 |
| H: Systemic Hormonal Preparations |
0.8 |
1.7 |
2.0 |
2.5 |
1.4 |
1.5 |
1.6 |
1.0 |
| J: General Antiinfectives for Systemic use; and P: Antiparasitic Products42 |
5.2 |
7.2 |
9.4 |
7.7 |
7.6 |
7.6 |
2.8 |
8.0 |
| L: Antineoplastics and Immunomodulating Agents |
6.4 |
6.2 |
8.2 |
11.0 |
3.4 |
6.9 |
4.0 |
3.6 |
| M: Musculo-skeletal System |
6.3 |
5.7 |
6.6 |
6.2 |
5.5 |
6.8 |
4.9 |
4.3 |
| N: Nervous System |
19.7 |
19.6 |
15.8 |
19.3 |
13.4 |
18.2 |
23.3 |
27.4 |
| R: Respiratory System |
7.6 |
10.1 |
8.7 |
8.4 |
9.2 |
8.8 |
14.1 |
11.0 |
| S: Sensory Organs |
1.5 |
1.9 |
1.8 |
1.7 |
2.4 |
1.9 |
1.6 |
2.0 |
| V: Various |
0.2 |
0.3 |
0.3 |
0.7 |
0.1 |
0.1 |
0.1 |
0.2 |
| Total |
100.0 |
100.0 |
100.0 |
100.0 |
100.0 |
100.0 |
100.0 |
100.0 |
Source: Calculated by PMPRB from sales data contained in IMS Health´s MIDAS database.
37 IMS Health´s Retail Drug Monitor, 2007 (www.imshealth.com). IMS Retail Drug Monitor provides estimates of direct (i.e., from the manufacturing company) and indirect (i.e., through a wholesaler) drug purchases by pharmacies in 13 major markets: Argentina, Australia, Brazil, Canada, France, Germany, Italy, Japan, Mexico, New Zealand, Spain, the U.K. and the U.S. These figures are at ex-manufacturer prices and include all prescription and certain over-the-counter data. IMS estimates the above 13 markets account for over two thirds of the world pharmaceutical market. This implies Canada´s share of the world market is approximately 2.5%.
38 To calculate the shares given in Figures 16 and 17, it is necessary to first express national sales data in a common currency. IMS Health uses market exchange rates for this purpose. This means the Canadian shares reported here can be strongly influenced by changes in relative value of the Canadian dollar.
39 This Canadian growth rate reported here differs from that reported in Table 8, on page 24, for a number of reasons. Most importantly, it is derived from sales data encompassing non-patented as well as patented drugs. Note as well that these data cover only sales to the pharmacy sector.
40 Comparisons made on this basis will reflect international differences in prices, overall utilization and patterns of therapeutic choice, as well as differences in national income.
41 Data used in these calculations (1) cover only sales to pharmacies, (2) include generic and non-patented branded drug products and (3) are derived from surveys of drug purchasers rather than directly reported by manufacturers. Hence, the results reported for Canada in Table 16 are not directly comparable to those in Table 10, on page 26.
42 These groups have been combined for reasons of confidentiality.
Analysis of Research and Development Expenditure
The Patent Act (Act) mandates the PMPRB to monitor and report on pharmaceutical research and development (R&D) spending (while giving the PMPRB no regulatory authority over the amount or type of patentees´ research spending). This chapter provides key statistics on the current state of pharmaceutical research investment in Canada.
Data Sources
The Act requires each patentee to report its revenue from sales of drugs (including revenue from sales of non-patented drugs and from licensing agreements) and R&D expenditure in Canada related to medicines. The results presented here were entirely derived from data patentees have submitted to the PMPRB.
The Patented Medicines Regulations (Regulations) require that R&D data submitted to the PMPRB be accompanied by a certificate stating that the submitted information is “true and correct”. The PMPRB does not audit submissions, but it does review submitted data for anomalies and inconsistencies, seeking corrections or clarifications from patentees where necessary. To confirm that Board Staff has correctly interpreted submitted data, each patentee is given the opportunity to review and confirm the accuracy of its own R&D-to-sales ratio before publication of this report.
Companies without sales of patented medicines need not report on their R&D activity. For this reason, as new patents are granted and others expire, the set of companies required to file R&D data may change from year to year. In 2007, a total of 82 companies selling human and veterinary drug products filed reports on their R&D expenditure. Of these, 35 were members of Canada´s Research Based Pharmaceutical Companies (Rx&D).
Failure to File
Under subsection 89(3) of the Act, the PMPRB is required to report the identity of patentees who fail to file information before March 1, 2008 as per section 88 of the Act. One company, Iroko Pharmaceuticals, failed to file information on their R&D expenditure by the above date. A Board Order was issued to Iroko. The patentee met its filing obligations.
Sales Revenue
For reporting purposes, sales revenue is defined as all revenue from sales in Canada of medicines43 and from licensing agreements (e.g., royalties and license fees from sales in Canada by licensees). Patentees reported total 2007 sales revenue (Table 17 on page 42) of $15.9 billion, up 7.3% from 2006. Sales revenue reported by Rx&D members was $13.4 billion, accounting for 83.7% of the total. Less than 1% of reported sales revenue was generated by licensing agreements.
R&D Expenditure
Pursuant to Section 6 of the Regulations, patentees are required to report R&D expenditure that would have qualified for an Investment Tax Credit for scientific research and experimental development under the provisions of the Income Tax Act in effect on December 1, 1987. By this definition, R&D expenditure may include current expenditure, capital equipment costs and allowable depreciation expenses. Market research, sales promotions, quality control or routine testing of materials, devices or products and routine data collection are not eligible for an Investment Tax Credit, and therefore are not to be included in patentees´ filings.
Table 17 provides the total amount of R&D expenditure reported by patentees over the period 1988 through 2007. R&D expenditure was $1,325.0 million in 2007, an increase of 9.5% over 2006. Rx&D members reported R&D expenditure of $1,184.0 million in 2007, an increase of 24.4% over last year. Rx&D members accounted for 89.4% of all reported R&D expenditure. Patentees that were not members of Rx&D reported R&D expenditure of $141 million in 2007, a decrease of 45.9% over last year.
R&D-to-Sales Ratios
Table 17, on page 42, also provides ratios of R&D expenditure to sales revenue. With the adoption of the 1987 amendments to the Act, Rx&D made a public commitment to increase their annual research-and-development (R&D) expenditure to 10% of sales revenue by 1996.44 The ratio of R&D expenditure to sales revenue among all patentees was 8.3% in 2007, up from 8.1% in 2006.45 The ratio for members of Rx&D was 8.9%, up from 8.5% in the previous year. As shown in Figure 21, R&D-to-sales ratios for all patentees and for Rx&D members have declined in recent years, after rising from 1988 to the mid-1990´s. As of 2007, the ratio for all patentees has remained below 10% for seven consecutive years, while the ratio for Rx&D members has been less than 10% for the last five years.
Table 22 in Annex 3, on page 59, provides details on the range of R&D-to-sales ratios. Of the 82 companies reporting in 2007, 68 had R&D-to-sales ratios below 10% in 2007. These companies accounted for 76.0% of total sales revenue in 2007.
Current Expenditure by Type of Research
Table 18 and Figure 22 provide information on the allocation of 2007 current R&D expenditure46 among basic research, applied and other qualifying R&D.47 Patentees reported spending $259 million on basic research in 2007, representing 20.3% of current R&D expenditure and an increase of 11.4% over the previous year. Patentees reported spending $688.2 million on applied research, representing 54.4% of current R&D expenditure. Clinical trials accounted for 78.0% of applied research expenditure.
Table 18 Current R&D Expenditure by Type of Research, 2007 and 2006
| Type of Research |
2007 |
2006 |
Annual Increase in Expenditure |
| $M |
% |
$M |
% |
% |
| Basic |
259.0 |
20.3 |
232.4 |
20.0 |
11.4 |
| - Chemical |
122.6 |
9.6 |
113.3 |
9.8 |
8.2 |
| - Biological |
136.4 |
10.7 |
119.1 |
10.3 |
14.5 |
| Applied |
688.2 |
54.4 |
689.6 |
59.5 |
-0.7 |
| - Manufacturing Process |
92.1 |
7.3 |
68.5 |
5.9 |
34.5 |
| - Pre-Clinical Trial I |
12.4 |
1.0 |
46.6 |
4.0 |
-73.4 |
| - Pre-Clinical Trial II |
46.3 |
3.7 |
40.6 |
3.5 |
14.0 |
| - Clinical Trial Phase I |
62.0 |
4.9 |
59.0 |
5.0 |
5.1 |
| - Clinical Trial Phase II |
121.6 |
9.6 |
112.9 |
9.7 |
7.7 |
| - Clinical Trial Phase III |
353.8 |
27.9 |
361.8 |
31.2 |
-2.4 |
| Other Qualifying R&D |
326.8 |
25.6 |
237.4 |
20.5 |
37.7 |
| Total |
1,274.0 |
100.0* |
1,159.4 |
100.0* |
9.8 |
Current Expenditure by R&D
Performer and Source of Funds Patentees report expenditure on research they conduct themselves (intramural) and research performed by other establishments, such as universities, hospitals and other manufacturers (extramural). Table 19 shows that, in 2007, 53.3% of current expenditure was intramural, up from 50.5% in 2006. Research performed by other companies on behalf of patentees was 19.7% of current expenditure, while research conducted in universities and hospitals accounted for 14.0%.
Table 20 provides information on the sources of funds used by patentees to finance their R&D activity. Internal company funds remained by far the single largest source of funding in 2007, accounting for 91.1% of current R&D expenditure. Funds received from government amounted to only 2.5% of current expenditure.
Current R&D Expenditure by Location
Table 21 (as well as Table 24 in Annex 3, on page 62) provide current R&D expenditure by province. As in previous years, expenditure was heavily concentrated in Ontario and Québec, with these provinces accounting for 88.7% of total expenditure. While R&D expenditure grew at a year-over-year rate of 24.1% in Western Canada, the rate of expenditure growth in Ontario (4.2%) was less than half the national average (9.8%).
The Global Context
Figure 23 compares Canadian R&D-to-sales ratios to those in the PMPRB´s seven comparator countries for the years 2000 and 2005. As noted previously, Canada´s ratio stood at 10.1% in 2000. Only Italy, at 6.2%, had a lower ratio in that year. Switzerland had the highest ratio at 102.5%, followed by Sweden at 44.4%. France, Germany and the U.S. were in the 16-18% range, while the U.K. was more than double (35.1%). A very similar pattern emerges in the investment-to- sales ratios for 2005. Italy (6.8%) remained at the bottom of the range, with Canada second lowest at 8.3%. Ratios in all other comparator countries remained well above Canada´s ratio.
43 Sales data reported in this section include sales of drugs for both human and veterinary use.
44 As published in the Regulatory Impact Assessment Statement (RIAS) of the Patented Medicines Regulations, 1988, published in the Canada Gazette, Part II, Vol. 122, No. 20 – SOR/DORS/88-474
45 The R&D-to-sales ratios presented in Table 17, include research expenditure funded by government grants. If the government-funded component is excluded, the ratios for all patentees and for the members of Rx&D in 2007 are 8.0% and 8.6%, respectively.
46 Current R&D expenditure consists of non-capital expenses directly related to research, including (a) wages and salaries, (b) direct material, (c) contractors and sub-contractors, (d) other direct costs such as factory overhead, (e) payments to designated institutions, (f) payments to granting councils and (g) payments to other organizations. These elements are described in more detail in the Patentee´s Guide to Reporting – Form 3, available from the PMPRB Web site under Legislation, Regulations and Guidelines.
Current R&D expenditure accounted for 96.1% of total R&D expenditure in 2007, while capital equipment costs and allowable depreciation expenses made up 2.1% and 1.8%, respectively.
47 “Basic research” is defined here as work that advances scientific knowledge without a specific application in mind. “Applied research” is directed toward a specific practical application, comprising research intended to improve in manufacturing processes, pre-clinical trials and clinical trials. “Other qualifying research” includes drug regulation submissions, bioavailability studies and Phase IV clinical trials.
National Prescription Drug Utilization Information System
The National Prescription Drug Utilization Information System (NPDUIS) provides critical analyses of price, utilization and cost trends in Canada. The Canadian Institute for Health Information (CIHI) and the PMPRB are partners in this initiative.
The NPDUIS initiative involves two major elements:
- development of a database incorporating data on individual claims made against public drug plans; and
- production of analytical reports using information in this database.
CIHI is responsible for the first of these elements while the PMPRB (as requested by the Minister of Health under section 90 of the Patent Act) is principally responsible for the second. A steering committee, comprised of representatives of participating public drug plans (all jurisdictions except Quebec) and Health Canada, advises the PMPRB on its research agenda and individual studies.
A major new NPDUIS periodical report was inaugurated in 2007. The New Drug Pipeline Monitor (NDPM) summarizes information on new drugs that are expected to be launched in Canada within the next two to five years and could have a significant impact on the expenditures of public drug plan expenditures. The first report was released in June 2007.
As well, a report entitled Budget Impact Analysis Guidelines was released in May 2007. This report provides a best-practices framework for predicting the likely financial impact on a drug plan of listing a new medicine.
At the time of publication of this Annual Report, several new NPDUIS reports were being prepared for release in the near future.
- The 2008 edition of the Pharmaceutical Trends Overview Report (PTOR) will update the PMPRB´s previous analyses of expenditure trends among public drug plans in Canada
- A second issue of the NDPM report will update the set of “pipeline” drugs, while providing a special review of oncology drugs in development.
- A new study will examine the impact of longterm demographic change on public drug plans in Canada
- A new study will analyze recent trends in reimbursement of dispensing fees and other costs incurred at the retail level
- Obtaining meaningful measures of treatment volumes is a critical step in cost-driver and utilization analysis. A new study will critically evaluate methodological options for doing this
In addition, best-practices guidelines are being developed for the forecasting of drug plan expenditures at the level of therapeutic class. It is expected these guidelines will be published by the end of 2008.
All studies conducted under the NPDUIS are available on the PMPRB Web site, as is a list of ongoing projects.
Monitoring and Reporting of Non-Patented Prescription Drug Prices
In October 2005, the federal/provincial/territorial Ministers of Health announced the endorsement of the PMPRB to monitor and report on non-patented prescription drug prices (NPPDP). In November 2005, the PMPRB received direction from the federal Minister of Health, on behalf of himself and his colleagues, to undertake this monitoring and reporting. To-date, four reports have been released
- Canadian and Foreign Price Trends (July 2006), which examined domestic and international price and sales trends of non-patented prescription drugs;
- Trends in Canadian Sales and Market Structure (October 2006), which analyzed annual growth rates in sales, sources of growth, market shares, sales concentration, and international price comparisons by level of concentration;
- Market for New Off-Patent Drugs (June 2007), which examined market-entry and pricing behaviour among drugs that had recently gone off-patent; and
- Non-Patented Single-Source Drugs in Canada (November 2007), which examined price trends among non-patented drugs with only a single Canadian supplier.
At the time of publication of this Annual Report, two new NPPDP reports were being prepared for release in the near future. These will update the first two reports listed above, applying several methodological refinements, and focusing on generic drugs.
As of April 2008, NPPDP studies are conducted under the umbrella of the NPDUIS.
Amendments to the Patented Medicines Regulations
The regulatory amendments to the Patented Medicines Regulations, 1994 (Regulations) were registered on March 6, 2008 and received final publication in the Canada Gazette, Part II, on March 19, 2008. These amendments modernize the Regulations by increasing efficiency and timeliness in the price review process for patented medicines.
This regulatory initiative began in January 2005 with the publication of a Notice and Comment proposal to amend the Regulations, followed by the initial pre-publication of the proposed regulatory amendments in the Canada Gazette, Part I, on December 31, 2005. Following extensive stakeholder consultations, a revised regulatory package was pre-published in the Canada Gazette, Part I, on October 6, 2007. Several stakeholder submissions were received during the second pre-publication consultation period. These submissions remain posted on the PMPRB Web site for the information of all interested parties.
In response to stakeholder concerns, the final amendments contained two changes from the proposed amendments which were pre-published on October 6, 2007:
- the proposed requirement that patentees identify the type of reductions used in the calculation of average price per package or net revenue from sales was removed; and
- the date of the coming into force of the electronic filing requirement was changed from January 1, 2009 to July 1, 2008, as the electronic forms no longer needed to be revised to accommodate the filing of reduction information by type.
The amendments also put into place the following changes regarding reporting information to the PMPRB via Forms 1, 2, and 3:
Regulatory Filing
- Information identifying the medicine (i.e., Form 1) shall now be accompanied by the product monograph for the medicine or, if a notice of compliance (NOC) has not been issued in respect of the medicine, by information similar to that contained in a product monograph.
- Information identifying the medicine (i.e., Form 1) shall now be provided no later than the earlier of seven days after the day on which the first NOC is issued in respect of the medicine, and seven days after the day on which the medicine is first offered for sale in Canada.
Patented Prescription Medicine
Where a patented prescription medicine is for human use, information on the prices of the medicine (i.e., Form 2) shall now be provided for the day on which the medicine is first sold in Canada within 30 days after that day; this replaces the previous requirement that information be provided on the first 30 day sales.
Veterinary and Over-the-Counter Medicines
- For veterinary and over-the-counter medicines, information on the prices of the medicine (i.e., Form 2) shall now be provided on a complaints-based approach, wherein a patentee shall provide to the Board the necessary information for each six-month period, beginning on January 1 and July 1 of each year, within 30 days after the date on which the Board sends a request in response to a complaint respecting the price of a medicine, and during the two years following the request within 30 days after each six-month period.
Electronic Filing
- Patentees are now required to provide information for all three forms to the Board using a specified electronic document in its original format and file type, bearing the electronic signature of an authorized individual, certifying that the information set out in the document is true and complete. Patentees were required to comply with the amended Regulations as of their final publication on March 19, 2008, with the exception of the electronic filing requirement which must be complied with as of July 1, 2008. Board Staff provided information sessions to patentees in May and June 2008 to explain how to fully comply with the regulatory amendments.
Review of the Board’s Excessive Price Gidelines
Throughout 2007, the Board was actively engaged in the review of its Excessive Price Guidelines (Guidelines) to ensure that they remain relevant and appropriate in the context of the current pharmaceutical environment. The review exercise began with the Discussion Paper on Price Increases in 2005, but the recent focus of the exercise, launched in early 2006, was on introductory prices as well as price changes.
The activities undertaken as part of the Guidelines review in 2007 build on the work of the previous year, which began with the release of the Discussion Guide on the Board's Excessive Price Guidelines in May 2006. This was followed by a series of national consultations in November 2006, where the Board met with close to 140 members of various stakeholders groups at sessions held in Edmonton, Montreal, Toronto, Halifax and Ottawa.
On May 31, 2007, the Board released a Stakeholder Communiqué outlining its preliminary decisions and directions on the issues under consultation to date, as well as the next steps over the remainder of the year. The Stakeholder Communiqué also signaled the launch of three new Working Groups: one to determine definitions and levels of evidence for various categories of therapeutic improvement; one to determine appropriate therapeutic comparators for domestic drug products in other countries; and one to seek input from experts on how to define the costs of making and marketing a drug product (subsection 85(2) of the Patent Act).
In the midst of the more general review of the Guidelines, in March 2007, the Federal Court (FC) issued a decision in response to a judicial review application in the matter of LEO Pharma Inc. and the price of the patented medicine Dovobet. In April 2007, the PMPRB published an article in its NEWSletter informing stakeholders of the implications and impacts of the FC decision. Stakeholders were instructed that all benefits (as defined by the Patented Medicines Regulations (Regulations) in subsections 4(4) and 4(5), hereinafter referred to simply as “benefits”, must now be included in the calculation of the average price of a patented medicine.
Significant concern was expressed by the patented pharmaceutical industry regarding the potential disincentives the decision would have on the willingness of companies to offer, or continue to provide, various benefits to their customers. Representatives of the innovative pharmaceutical and biotechnology industries were then given the opportunity to comment on the implications of the FC decision during face-to-face meetings with the Board during the summer of 2007.
On September 10-12, 2007, the Board held a series of bilateral consultation meetings with stakeholder groups, representing sectors of the pharmaceutical industry (innovative, biotechnology and generic), federal/provincial/territorial (F/P/T) governments and consumers. The purpose of these meetings was to provide participating stakeholders with an opportunity to raise their comments directly with Board Members in relation to the issues discussed in the Stakeholder Communiqué of May 31, 2007, the FC decision, as well as other concerns they may, or may not have raised in previous consultations.
In order to address the issues arising from both the review of the Guidelines and the FC decision, the Board released the Discussion Paper – Options for Possible Changes to the Patented Medicines Regulations, 1994 and the Excessive Price Guidelines on January 31, 2008. In total, the Board received 43 submissions from a wide range of stakeholders. In keeping with the Board´s commitment to openness and transparency, all stakeholder submissions can be found on the PMPRB Web site.
In early April 2008, the Board also received the final reports of both the Working Group on Therapeutic Improvement, and the Working Group on International Therapeutic Class Comparison. Building on the efforts of the previous two Working Groups, the Board launched an additional Working Group to develop advice and options for possible changes to the PMPRB´s price tests. The Working Group on Price Tests and the work on the costs of making and marketing are expected to be concluded by the spring of 2008.
Recognizing that this first major review of the Guidelines since 1994 may create a certain degree of uncertainty for patentees and other stakeholders regarding the future of the price review process, the Board is committed to ongoing open communication through its NEWSletter, its Web site and other means, as appropriate.
Communications
Communications Program
The Communications Program is primarily responsible for planning and managing the PMPRB´s external communications activities, as well as raising the organization´s visibility. It focuses on adapting to the changing requirements of the PMPRB´s operating environment.
The main responsibilities of developing and managing the external communications activities also include relations with the media and reporting on the Board´s quasi-judicial proceedings. The program participates in setting the strategic direction of the PMPRB and the development of key policies. The Communications Program seeks to sustain high levels of transparency, accessibility and stakeholder engagement.
Publications
The PMPRB informs its stakeholders regularly through its publications. The Annual Report and the NEWSletter, published at regular intervals throughout the year, along with other publications, are released in response to program and corporate requirements. All PMPRB´s publications, including Board decisions in hearings, are available on its Web site.
Publications
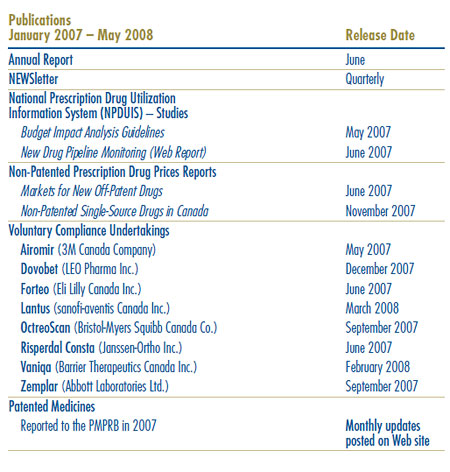
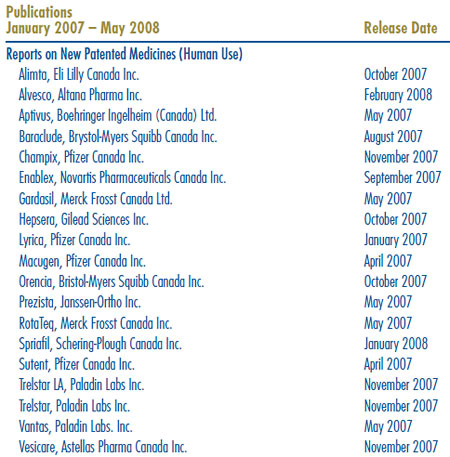
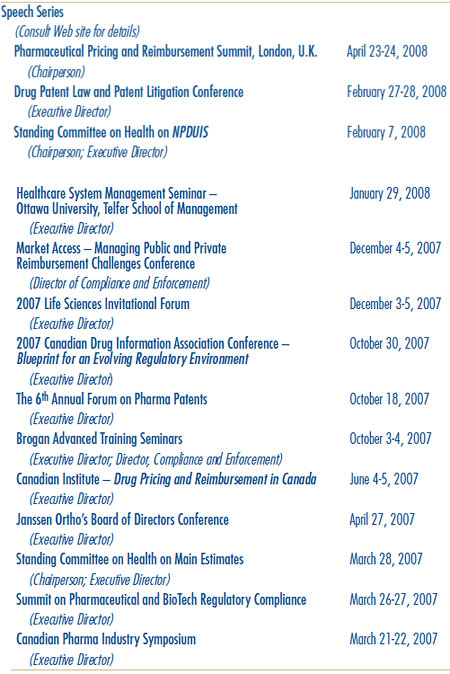
Glossary
This glossary is included for the convenience of the reader. For more detailed information and definitions please refer to the Patent Act, the Patented Medicines Regulations, the PMPRB Compendium of Guidelines, Policies and Procedures49 and the Food and Drugs Regulations, or contact the PMPRB.
Active Ingredient:
Chemical or biological substance responsible for the claimed pharmacologic effect of a drug product. Advance Ruling Certificate (ARC): A non-binding advance ruling certificate may be issued pursuant to subsection 98(4) of the Patent Act at the request of a patentee when the Board is satisfied that the price or proposed price of the medicine would not exceed the maximum non-excessive price under the Board´s Excessive Price Guidelines.
ATC:
Anatomical Therapeutic Chemical (ATC) classification system, developed and maintained by the World Health Organization (WHO) Collaborating Centre for Drug Statistics Methodology, divides drugs into different groups according to their site of action and therapeutic and chemical characteristics. This system is used by the PMPRB as a guide for selecting comparable medicines for purposes of price review.
Dedication of Patent:
A practice whereby a patentee notifies the Commissioner of Patents that it has surrendered its rights and entitlements flowing from the patent for the benefit of the public to use and enjoy.
NB: As of January 30, 1995, the Board does not recognize dedication of patent as a means to remove the medicine from its jurisdiction. Drug Identification Number (DIN): A registration number (drug identification number) that the Health Products and Food Branch of Health Canada assigns to each prescription and non-prescription drug product marketed under the Food and Drugs Regulations. The DIN is assigned using information in the following areas: manufacturer of the product; active ingredient(s); strength of active ingredient(s); pharmaceutical dosage form; brand/trade name; and route of administration.
Drug Product:
A particular presentation of a medicine characterized by its pharmaceutical dosage form and the strength of the active ingredient(s). Drug Product, Existing: An existing drug product is a DIN for which a benchmark price has been established in accordance with the Board´s Guidelines. (See Chapter 1, page 12 of the Compendium of Guidelines, Policies and Procedures.)
Drug Product, New:
A new drug product is one for which the introductory price is under review. Patented drug products are considered new in the year during which they are first introduced on the market in Canada or the year they receive their first patent(s) if previously marketed. For price review purposes, new drug products for a given year are those introduced between December 1, of the previous year and November 30, of the reporting year. Because of the filing requirements under the Patented Medicines Regulations and the manner of calculating benchmark prices, drug products introduced in December are considered to have been introduced in the following year. (See Chapter 1, page 11 of the Compendium of Guidelines, Policies and Procedures.)
Emergency Drug Release (EDR) Program:
See Special Access Program.
Failure to File (FTF):
The complete or partial failure of a patentee to comply with regulatory filing requirements pursuant to the Patent Act and the Patented Medicines Regulations.
Generic Product:
A drug product with the same active ingredient, strength and dosage form of a brand name drug product.
Investigational New Drug (IND):
A drug that has been authorized for clinical evaluation (i.e. testing on humans) by Health Canada but that is not yet approved for sale for the indication under study.
License, Compulsory:
Referred to in subsection 79(1) of the Patent Act, means a license granted by the Commissioner of Patents, before December 20, 1991, in accordance with subsection 39(4) of the Patent Act, R.S., 1985, c. P-4 that has been continued pursuant to subsection 11(1) of the Patent Act Amendment Act, 1992 which permits the licensee to import, make, use or sell a patented invention pertaining to a medicine. Royalties payable are determined by the Commissioner of Patents who sets the terms of licenses pursuant to subsection 39(5) of the Patent Act.
License, Voluntary:
A contractual agreement between a patent holder and a licensee under which the licensee is entitled to enjoy the benefit of the patent or to exercise any rights in relation to the patent for some consideration (i.e., royalties in the form of a share of the licensee´s sales.)
Medicine:
Any substance or mixture of substances made by any means, whether produced biologically, chemically, or otherwise, that is applied or administered in vivo in humans or in animals to aid in the diagnosis, treatment, mitigation or prevention of disease, symptoms, disorders, abnormal physical states, or modifying organic functions in humans and or animals, however administered. For greater certainty, this definition includes vaccines, topical preparations, anaesthetics and diagnostic products used in vivo, regardless of delivery mechanism (e.g. transdermal, capsule form, injectable, inhaler, etc.). This definition excludes medical devices, in vitro diagnostic products and disinfectants that are not used in vivo. (See Compendium of Guidelines, Policies and Procedures, Introduction, subsection 1.5.)
Notice of Compliance (NOC):
A notice in respect of a medicine issued by the Health Products and Food Branch of Health Canada under section C.08.004 of the Food and Drugs Regulations. The issuance of a NOC indicates that a drug product meets the required Health Canada standards for use in humans or animals and that the product is approved for sale in Canada.
Patent:
An instrument issued by the Commissioner of Patents in the form of letters patent for an invention that provides its holder with a monopoly limited in time, for the claims made within the patent. A patent gives its holder and its legal representatives, the exclusive right of making, constructing and using the invention and selling it to others to be used.
Patented Medicine Price Index (PMPI):
The PMPI has been developed by the PMPRB as a measure of average year-over-year change in the transaction prices of patented drug products sold in Canada, based on the price and sales information reported by patentees.
Patentee:
As defined by subsection 79(1) of the Patent Act, “the person for the time being entitled to the benefit of the patent for that invention and includes, where any other person is entitled to exercise any rights in relation to that patent other than under a license continued by subsection 11(1) of the Patent Act Amendment Act, 1992, that other person in respect of those rights;”
Pending Patent:
An application for a patent that has not yet been issued.
NB: In cases where a medicine is sold before a patent is issued, it is the Board´s policy once the patent is issued, to review the price of the medicine as of the date on which the patent application was laid open for public inspection.
Research and Development (R&D):
Basic or applied research for the purpose of creating new, or improving existing, materials, devices, products or processes (e.g. manufacturing processes).
Research and Development— Applied Research:
Work that advances scientific knowledge with a specific practical application in view such as creating new or improved products or processes through manufacturing processes or through preclinical or clinical studies.
Research and Development— Basic Research:
Work that advances scientific knowledge without a specific application in view.
Research and Development— Clinical Research:
The assessment of the effect of a new medicine on humans. It typically consists of three successive phases, beginning with limited testing for safety in healthy humans then proceeding to further safety and efficacy studies in patients suffering from the target disease.
Research and Development— Preclinical Research:
Tests on animals to evaluate the pharmacological and toxicological effects of medicines.
Research and Development— Other Qualifying:
Includes eligible research and development expenditures that cannot be classified into any of the preceding categories of “type of research and development”. It includes drug regulation submissions, bioavailability studies and Phase IV clinical trials.
Research and Development Expenditures:
For the purposes of the Patented Medicines Regulations, in particular sections 5 and 6, research and development includes activities for which expenditures would have qualified for the investment tax credit for scientific research and experimental development under the Income Tax Act as it read on December 1, 1987.
Current Research and Development Expenditures:
Consist of the following non-capital expenses that are directly related to research work: (a) wages and salaries, (b) direct material, (c) contractors and subcontractors, (d) other direct costs such as factory overhead, (e) payments to designated institutions, (f) payments to granting councils and (g) payments to other organizations. These elements are described in greater detail in the Patentees´ Guide to Reporting – Form 3, available from the PMPRB Web site under “Legislation, Regulations and Guidelines.”
Special Access Programme (SAP):
A program operated by Health Canada to give practitioners access to drugs that are not approved or otherwise available for sale in Canada. (Formerly the EDR Program.)
Voluntary Compliance Undertaking (VCU):
A written undertaking by a patentee to adjust its price to conform to the PMPRB´s Excessive Price Guidelines (see Chapter 1 of the Compendium of Guidelines, Policies and Procedures). Pursuant to the Board´s Compliance and Enforcement Policy (see Chapter 2, section 7) the Chairperson may approve a VCU in lieu of issuing a Notice of Hearing if it is consistent with the Patent Act and the policies of the Board and in the public interest. Under the Board´s Compliance and Enforcement Policy, a VCU can also be submitted following the issuance of a Notice of Hearing. A VCU submitted at this point must be approved by the Board. The Board reports publicly on all VCUs approved by the Chairperson or the Board.
Acronyms
This section provides an alphabetical list of acronyms used in the Annual Report 2007. It is also available on our Web site.
ARC: Advance Ruling Certificate
ATC: Anatomical Therapeutic Chemical classification system
ATP: Average Transaction Price
CAC: Consumers´ Association of Canada
CADTH: Canadian Agency for Drugs and Technologies in Health
CCOHTA: Canadian Coordinating Office for Health Technology Assessment (see CADTH – Canadian Agency for Drugs and Technologies in Health)
CDR: Common Drug Review
CEDAC: Canadian Expert Drug Advisory Committee
CGPA: Canadian Generic Pharmaceutical Association
CIHI: Canadian Institute for Health Information
CPI: Consumer Price Index
DDD: Defined Daily Dose
DIN: Drug Identification Number
DPD: Drug Product Database (Health Canada)
DVA: Department of Veteran Affairs (U.S.)
EDR: Emergency Drug Release
FDA: Food and Drugs Act (Canada)
FNIHB: First Nations and Inuit Health Branch (Health Canada)
FPG: First Patent Granted
F/P/T: Federal/Provincial/Territorial
FSS: Federal Supply Schedule (U.S.)
FTF: Failure to File
FTR: Failure to Report
GDP: Gross Domestic Product
HDAP: Human Drug Advisory Panel
IPC: International Price Comparison
MIP: Median International Price
MNE: Maximum Non-Excessive (price)
MOA: Memorandum of Agreement
MOU: Memorandum of Understanding
NAS: New Active Substance
NDMAC: Nonprescription Drug Manufacturers Association of Canada
NICE: National Institute for Clinical Excellence (U.K.)
NIHB: Non-Insured Health Benefits Program (Health Canada)
NOC: Notice of Compliance
NPDUIS: National Prescription Drug Utilization Information System
NPS: National Pharmaceuticals Strategy
NPPDP: Non-Patented Prescription Drug Prices
NPSS: Non-Patented Single Source (drugs)
ODB: Ontario Drug Benefit Plan
OECD: Organization for Economic Cooperation and Development
OTC: Over-the-counter
PMPI: Patented Medicine Price Index
PMPRB: Patented Medicine Prices Review Board
PMQI: Patented Medicine Quantity Index
PPP: Purchasing Power Parity
R&D: Research and Development
Rx&D: Canada´s Research Based Pharmaceutical Companies
SAP: Special Access Programme
TCC: Therapeutic Class Comparison
TPD: Therapeutic Products Directorate (Health Canada)
VCU: Voluntary Compliance Undertaking
WHO: World Health Organization
Annex 1 - Criteria for Commencing an Investigation
Criteria for Commencing an Investigation
A price is considered to be within the Guidelines unless it meets the criteria for commencing an investigation. The criteria represent the standards the Board applies in order to allocate its resources to investigations as efficiently as possible. Their existence should not be construed as indicating that the Board accepts any deviation from the Guidelines.
The Board is satisfied that its criteria assure all significant cases of pricing outside the Guidelines will be subject to investigation. In most instances where a price exceeds the maximum excessive (MNE) price by an amount too small to trigger an investigation in one year, it is offset by a price below that which is permitted by the Guidelines the following year. The Board expects the prices of all patented medicines to be within the Guidelines and evidence of persistent pricing outside the Guidelines, even by an amount that does not trigger the criteria for commencing an investigation, may result in commencing an investigation.
New Drug Products
- The introductory price is 5% or more above the MNE price; or
- Excess revenues in the introductory period are $25,000 or more; or
- Complaints with significant evidence.
Existing Drug Products
- A price is 5% or more above the MNE price and there are cumulative excess revenues of $25,000 or more over the life of the patent after January 1, 1992; 50
- Cumulative excess revenues are $50,000 or more over the life of the patent after January 1, 1992; or
- Complaints with significant evidence.
For more information on the Criteria for Commencing and Investigation, consult Schedule 5 of the Compendium of Guidelines, Policies and Procedures available on our Web site under Legislation, Regulations, Guidelines.
Annex 2 - Patented Drug Products Introduced in 2007
| Brand Name |
Company |
DIN |
NAS1/FPG2 |
ATC3 |
Status |
Category |
| Abraxane 100 mg/vial |
Abraxis Oncology |
02281066 |
FPG |
L |
Under Investigation |
3 |
| Actonel 75 mg/tablet |
Procter & Gamble Pharmaceuticals Canada Inc. |
02297787 |
M |
Within Guidelines |
1 |
| Aldurazyme 0.58 mg/mL |
Genzyme Canada Inc. |
02254506 |
NAS/FPG |
A |
Within Guidelines |
2 |
| Androgel 1% – 1.25 gm/dose |
Solvay Pharma Inc. |
02249499 |
FPG |
G |
Under Investigation |
1 |
| Androgel 1% – 2.5 gm/pouch |
Solvay Pharma Inc. |
02245345 |
FPG |
G |
Under Investigation |
1 |
| Androgel 1% – 5.00 gm/pouch |
Solvay Pharma Inc. |
02245346 |
FPG |
G |
Within Guidelines |
1 |
| Atripla 600/200/300 – 1100 mg/tablet |
Gilead Sciences Inc. |
02300699 |
J |
Within Guidelines |
3 |
| Benefix 1000 unit/vial |
Wyeth Pharmaceuticals |
02293781 |
B |
Within Guidelines |
1 |
| Celsentri 150 mg/tablet |
Pfizer Canada Inc. |
02299844 |
NAS |
J |
Within Guidelines |
3 |
| Celsentri 300 mg/tablet |
Pfizer Canada Inc. |
02299852 |
NAS |
J |
Within Guidelines |
3 |
| Champix - starter kit (0.5/1.0 mg tablets) |
Pfizer Canada Inc. |
02298309 |
NAS |
N |
Within Guidelines |
3 |
| Champix 0.5 mg/tablet |
Pfizer Canada Inc. |
02291177 |
NAS |
N |
Within Guidelines |
3 |
| Champix 1 mg/tablet |
Pfizer Canada Inc. |
02291185 |
NAS |
N |
Within Guidelines |
3 |
| Ciprodex 3/1– 3.1 mg/mL |
Alcon Canada Ltd. |
02252716 |
FPG |
S |
Under Investigation |
3 |
| Clobex Shampoo 0.5 mg/mL |
Galderma Canada Inc. |
02256371 |
FPG |
D |
Within Guidelines |
3 |
| Differin XP 3 mg/gm |
Galderma Canada Inc. |
02274000 |
D |
Within Guidelines |
1 |
| Diovan 320 mg/tablet |
Novartis Pharma Canada Inc. |
02289504 |
A |
Within Guidelines |
1 |
| Emend 125 mg/80 mg |
tripak Merck Frosst Canada Ltd. |
02298813 |
NAS |
A |
Within Guidelines |
3 |
| Emend 125 mg/capsule |
Merck Frosst Canada Ltd. |
02298805 |
NAS |
A |
Within Guidelines |
3 |
| Emend 80 mg/capsule |
Merck Frosst Canada Ltd. |
02298791 |
NAS |
A |
Within Guidelines |
3 |
| Emtriva 200 mg/capsule . |
Gilead Sciences Inc |
02272091 |
NAS |
J |
Within Guidelines |
3 |
| Eprex 30000 unit/syringe |
Janssen-Ortho Inc. |
02288680 |
B |
Under Investigation |
1 |
| Factive 320 mg/tablet |
Abbott Laboratories Ltd. |
02248968 |
NAS |
J |
Within Guidelines |
3 |
| Fosrenol 250 mg/tablet |
Shire Canada Inc.51 |
02287145 |
NAS |
V |
Within Guidelines |
3 |
| Fosrenol 500 mg/tablet |
Shire Canada Inc. |
02287153 |
NAS |
V |
Within Guidelines |
3 |
| Fosrenol 750 mg/tablet |
Shire Canada Inc. |
02287161 |
NAS |
V |
Within Guidelines |
3 |
| Fosrenol 1000 mg/tablet |
Shire Canada Inc. |
02287188 |
NAS |
V |
Within Guidelines |
3 |
| Humalog Mix 50/50 – 100 unit/mL |
Eli Lilly Canada Inc. |
02240297 |
A |
Within Guidelines |
1 |
| Hyzaar 100/12.5 – 112.5 mg/tablet |
Merck Frosst Canada Ltd. |
02297841 |
C |
Within Guidelines |
1 |
| Invega 3 mg/tablet |
Janssen-Ortho Inc. |
02300273 |
NAS |
N |
Under Review |
| Invega 6 mg/tablet |
Janssen-Ortho Inc. |
02300281 |
NAS |
N |
Under Review |
| Invega 9 mg/tablet |
Janssen-Ortho Inc. |
02300303 |
NAS |
N |
Under Review |
| Isentress 400 mg/tablet |
Merck Frosst Canada Ltd. |
02301881 |
NAS |
J |
Under Review |
| Mycamine 50 mg/vial |
Astellas Pharma Canada Inc. |
02294222 |
NAS |
J |
Within Guidelines |
3 |
| Naprelan 375 – 412.5 mg/tablet |
Oryx Pharmaceuticals Inc. |
02242505 |
M |
Within Guidelines |
1 |
| Naprelan 500 – 550 mg/tablet |
Oryx Pharmaceuticals Inc. |
02242506 |
M |
Within Guidelines |
1 |
| Nexavar 200 mg/tablet |
Bayer Inc. |
02284227 |
NAS/FPG |
L |
Within Guidelines |
3 |
| Novomix 30 Penfill – 100 unit/mL |
Novo Nordisk Canada Inc. |
02265435 |
A |
Within Guidelines |
1 |
| Orencia 250 mg/vial |
Bristol-Myers Squibb Canada Inc. |
02282097 |
NAS/FPG |
L |
Within Guidelines |
3 |
| Pediacel 0.5 ml/dose |
Sanofi Pasteur Limited |
02243167 |
J |
Within Guidelines |
1 |
| Prevacid Fastab 15 mg/tablet |
Abbott Laboratories Ltd. |
02249464 |
A |
Within Guidelines |
1 |
| Rasilez 150 mg/tablet |
Novartis Pharma Canada Inc. |
02302063 |
NAS |
C |
Under Review |
| Rasilez 300 mg/tablet |
Novartis Pharma Canada Inc. |
02302071 |
NAS |
C |
Under Review |
| Replagal 3.5 mg/vial |
Shire Human Genetics Therapies Inc. |
02249057 |
NAS/FPG |
A |
Within Guidelines |
2 |
| Reyataz 300 mg/capsule |
Bristol-Myers Squibb Canada Inc. |
02294176 |
J |
Within Guidelines |
1 |
| Sebivo 600 mg/tablet |
Novartis Pharma Canada Inc. |
02288389 |
NAS |
J |
Within Guidelines |
3 |
| Seroquel XR 200 mg/tablet |
AstraZeneca Canada Inc. |
02300192 |
N |
Within Guidelines |
1 |
| Seroquel XR 300 mg/tablet |
AstraZeneca Canada Inc. |
02300206 |
N |
Within Guidelines |
1 |
| Seroquel XR 400 mg/tablet |
AstraZeneca Canada Inc. |
02300214 |
N |
Within Guidelines |
1 |
| Seroquel XR 50 mg/tablet |
AstraZeneca Canada Inc. |
02300184 |
N |
Within Guidelines |
1 |
| Spirafil 40 mg/mL |
Schering-Plough Canada Inc. |
02293404 |
NAS |
J |
Within Guidelines |
2 |
| Tarceva 25 mg/tablet |
Hoffmann-La Roche Ltd. |
02269007 |
L |
Within Guidelines |
1 |
| Testim 1% – 5 gm/tube |
Paladin Laboratories |
02280248 |
FPG |
G |
Within Guidelines |
1 |
| Thelin 100 mg/tablet |
Encysive Pharmaceuticals Inc. |
02295636 |
NAS |
C |
Within Guidelines |
3 |
| Vasovist 244 mg/mL |
Bayer Inc. |
02286319 |
NAS |
V |
Within Guidelines |
3 |
| Voluven 60 mg/mL |
Fresenius Kabi Deutschland GmbH |
02278057 |
B |
Under Review |
| Xyrem 500 mg/mL |
Valeant Canada Limited |
02268272 |
NAS |
N |
Under Investigation |
3 |
| Zantac 150 150 mg/tablet |
McNeil Consumer Healthcare Canada |
02277301 |
A |
Within Guidelines |
1 |
| Zyprexa 20 mg/tablet |
Eli Lilly Canada Inc. |
02238851 |
N |
Within Guidelines |
1 |
| Zyprexa Zydis 20 mg/tablet |
Eli Lilly Canada Inc. |
02243089 |
N |
Within Guidelines |
1 |
| Zytram XL 150 mg/tablet |
Purdue Pharma |
02286424 |
NAS |
N |
Under Review |
| Zytram XL 200 mg/tablet |
Purdue Pharma |
02286432 |
NAS |
N |
Under Review |
| Zytram XL 300 mg/tablet |
Purdue Pharma |
02286440 |
NAS |
N |
Under Review |
| Zytram XL 400 mg/tablet |
Purdue Pharma |
02286459 |
NAS |
N |
Under Review |
The Board´s Guidelines establish three categories of new patented drug products for purposes of conducting introductory price reviews.
- Category 1 – a new DIN of an existing or comparable dosage form of an existing medicine, usually a new strength of an existing drug (line extension)
- Category 2 – the first drug to treat effectively a particular illness or which provides a substantial improvement over existing drug products, often referred to as "breakthrough" or substantial improvement.
- Category 3 – a new drug or new dosage form of an existing medicine that provides moderate, little or no improvement over existing medicines. For complete definitions of the categories, refer to the Compendium of Guidelines, Policies and Procedures, Chapter 3, section 3.
- NAS: New Active Substance
- FPG: First Patent Grant
- ATC: Anatomical Therapeutic Chemical Classification System
Annex 3 - Research & Development
Table 22 Range of R&D-to-Sales Ratios by Number of Reporting Companies and Total Sales Revenue, 2007 and 2006

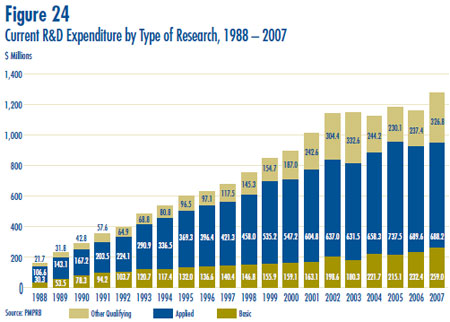

Source: PMPRB
- Revenue from royalties is included in calculating each company´s ratio, but not included in calculating industry-wide ratios (to avoid double-counting of sales revenue). Federal and provincial government grants are subtracted from the R&D expenditure in calculating individual R&D-to-sales ratios, but are included in calculating industry-wide ratios. Differences between the list of firms filing data on prices and those filing R&D data are due to differences in reporting practices of patentees and their affiliates or licensees. Also, some veterinary patentees (i.e., those without revenue from sales of products for human use) are required to file information on R&D expenditure but not price and sales information.
- Member of Rx&D
- Formerly known as Altana Pharma Inc. (prev. BYK Canada Inc.)
- Merged with Solvay Pharma Inc.
- Member of BIOTECanada
- Not a patentee in 2006
- Les Laboratories Inc. is the patent owner; however, BLES Biochemicals is the Licensee as well as manufacturer.
- Formerly known as ICN Canada Ltd.
- Formerly known as Fujisawa Canada Inc.
- Formerly known as Guilford Pharmaceuticals Inc.
- Formerly known as ESP Pharma Inc.
- Formerly known as Aventis Pasteur Limited
- Formerly known as Aventis Pharma Inc.
- Formerly Shire BioChem Inc.
- Division of Paladin Labs Inc.
Table 24 Current R&D Expenditures by Province and by R&D Performer, 2007
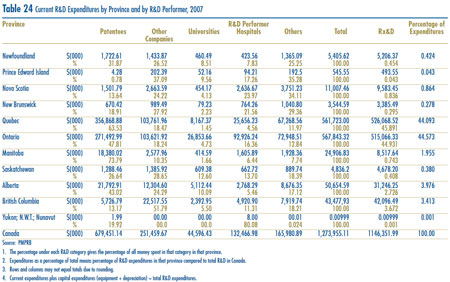
Source: PMPRB
- The percentage under each R&D category gives the percentage of all money spent in that category in that province.
- Expenditures as a percentage of total means percentage of R&D expenditures in that province compared to total R&D in Canada.
- Rows and columns may not equal totals due to rounding.
- Current expenditures plus capital expenditures (equipment + depreciation) = total R&D expenditures.