Annual Report 2012: In Brief
Link to full Annual Report 2012
The mandate of the Patented Medicine Prices Review Board is to ensure that prices at which patentees sell their patented medicines in Canada are not excessive; and to report on pharmaceutical trends of all medicines and on R&D spending by patentees.
The PMPRB Annual Report includes a review of the PMPRB's major activities, analyses of the prices of patented medicines and of the price trends of all drugs, and reports on the R&D expenditures as reported by patentees.
The PMPRB Annual Report: In Brief provides stakeholders/subscribers with all of the pertinent information contained within the Annual Report in a condensed format for easier access.
This year in an effort to further reduce our distribution costs and our carbon footprint, we are publishing both the Annual Report and the Annual Report: In Brief in electronic format only.
The Patented Medicine Prices Review Board Standard Life Centre,
Box L40 333 Laurier Avenue West, Suite 1400
Ottawa, ON K1P 1C1
Tel.: 613-952-7360
Fax: 613-952-7626
TTY: 613-957-4373
Email: pmprb@pmprb-cepmb.gc.ca
Web: www.pmprb-cepmb.gc.ca
Twitter: @PMPRB_CEPMB
ISSN: 2291-7322
Catalogue number: H78-1/2012E-PDF
All PMPRB publications are available in both official languages, and can be accessed on line or by calling our toll-free number: 1-877-861-2350
May 31, 2013
The Honourable Leona Aglukkaq, P.C., M.P.
Minister of Health
House of Commons
Ottawa, Ontario K1A 0A6
Dear Minister:
I have the pleasure to present to you, in accordance with sections 89 and 100 of the Patent Act, the Annual Report of the Patented Medicine Prices Review Board for the year ended December 31, 2012.
Yours very truly,
Mary Catherine Lindberg
Chairperson
About the Patented Medicine Prices Review Board
The Patented Medicine Prices Review Board (PMPRB) is an independent, quasi-judicial body established by Parliament in 1987 under the Patent Act (Act).
The PMPRB has a dual role:
- to ensure that prices at which patentees sell their patented medicines in Canada are not excessive
- to report on pharmaceutical trends of all medicines and on R&D spending by patentees
The PMPRB has no authority to regulate the prices of non-patented drugs and does not have jurisdiction over prices charged by wholesalers or pharmacies, or over pharmacists' professional fees.
As a reliable, impartial source of comprehensive information on drug prices, the PMPRB is committed to transparency, accessibility and stakeholder engagement.
Governance
The Board consists of up to five members who serve on a part-time basis. Members, including a Chairperson and a Vice-Chairperson, are appointed by the Governor-in-Council. The Chairperson is designated under the Act as the Chief Executive Officer of the PMPRB with the authority and responsibility to supervise and direct its work.
Organizational Structure and Staff
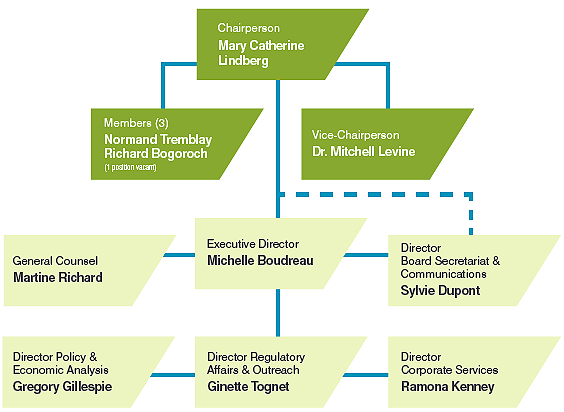
In 2012, the terms of appointment of Thomas (Tim) Armstrong and Anne Warner La Forest, who served the Board for ten and five years respectively, ended. They both made significant contributions to the PMPRB.
Budget
In 2012/13, the PMPRB had a budget of $11.058 million and an approved staff level of 76 full-time equivalent employees. $2.47 million of the total budget resided in a Special Purpose Allotment (SPA) reserved for public hearings. Unspent SPA funds were returned to the Consolidated Revenue Fund.
Program Evaluation Report and Management Response
In 2008/09, the Treasury Board Secretariat approved an increase in funding for the PMPRB to help it to effectively deliver its mandate. As a provision of receiving this ongoing increase in resources, the PMPRB agreed to conduct a complete evaluation of its programs in 2011/12. The goal of the evaluation was to assess the PMPRB's relevance, efficiency and effectiveness, and the extent to which the increased resources helped it achieve its objectives.
In 2012, the PMPRB began the program evaluation process. According to the evaluation, the incremental funding that was received in 2008/09 was effectively used and has achieved the results for which it was approved.
In early 2013, the PMPRB released the Program Evaluation Report, along with its Management Response and Action Plan, to address the considerations proposed in the Evaluation Report. Considerations included expediting all PMPRB processes; further simplifying the Guidelines; expanding plain language use throughout all PMPRB communications; and expanding the target audience for outreach efforts. The Management Response and Action Plan provides details on the initiatives and activities the PMPRB has undertaken or will be undertaking to address these considerations.
Regulatory Burden Reduction
In alignment with the Government's Red Tape Reduction Plan and the Economic Action Plan, as well as in response to the considerations identified in the 2011/12 PMPRB Program Evaluation, the PMPRB committed to examining its price review process to identify possible ways to reduce the regulatory burden on patentees without adversely affecting its mandate to protect consumer interests.
To date, the PMPRB's internal review has focused on two regulatory burden reduction initiatives to examine:
- the PMPRB's Consumer Price Index (CPI) Adjustment Methodology, and
- the feasibility of changing to one regulatory filing per year for existing patented medicines by patentees and modifying the requirement for patentees to submit information for the first day of sales of new patented drug products.
The PMPRB has recently put these initiatives to consultation.
Communications and Outreach
The PMPRB regularly informs its stakeholders of its activities through publications such as the quarterly NEWSletter and the Annual Report. It also publishes the results of NPDUIS analytical research reports. In 2012, the PMPRB continued its move to electronic-only publications to reduce costs and decrease the environmental impact of printing, placing a greater reliance on its website and social media for communicating with its stakeholders.
Both industry and non-industry stakeholders are regularly consulted and updated by the PMPRB. Industry stakeholders are promptly informed of changes in the operating environment and/or the regulatory process. To facilitate patentees' access to information, the Regulatory Affairs and Outreach Branch conducts outreach sessions with patentees.
In 2012, the PMPRB continued to enhance its non-industry stakeholder engagement through bilateral exchanges with federal/provincial/territorial health representatives, consumer representatives, patient-advocacy groups and others.
The PMPRB remains committed to meeting its objectives with openness and transparency.
Regulating the Prices of Patented Medicines
The PMPRB is responsible for regulating the prices that patentees charge for patented drug products sold in Canada to ensure that they are not excessive.
Patentees are required by law to file information pertaining to the sale of their drug products in Canada. The Patent Act (Act) along with the Patented Medicines Regulations (Regulations) set out the filing requirements, and Board Staff reviews the pricing information on an ongoing basis. The price of a patented drug product is under the PMPRB's jurisdiction until the patent expires.
Although patentees are not required to obtain approval of the price prior to selling the patented drug product, they are required to ensure that the price is not excessive.
Board Staff reviews the prices of each strength of an individual dosage form of each patented medicine sold in Canada. There are several factors used for determining whether a drug product is excessively priced, as outlined in section 85 of the Act. The Compendium of Policies, Guidelines and Procedures (Guidelines) details the various price tests used by Board Staff to determine whether a price charged by a patentee falls within the maximum allowable price.
When it finds that the price of a patented drug product appears to exceed the Guidelines, and the circumstances meet the criteria for commencing an investigation, Board Staff will conduct an investigation. An investigation could result in one of the following:
- its closure where it is concluded that the price was within the Guidelines
- a Voluntary Compliance Undertaking (VCU) by the patentee to reduce the price of the patented drug product to a non-excessive level and offset excess revenues obtained as a result of excessive price through a payment and/or an additional price reduction, or the price reduction of another patented drug product
- a recommendation from Board Staff to the Chairperson to issue a Notice of Hearing to hold a public hearing into the price of a patented medicine
Price Review of Patented Drug Products Reported to the PMPRB
The total number of patented drug products for human use in 2012 was 1,328. The table below provides a breakdown in terms of new and existing patented drug products as well as a summary of the status of the price review.
Patented Drug Products for Human Use Sold in 2012—Status of Price Review as of March 31, 2013
(Table 4 of the full Annual Report)
| |
New drug products introduced in 2012 |
Existing drug products |
Total |
| Total |
82 |
1,246 |
1,328 |
| Within Guidelines |
57 |
1,033 |
1,090 |
| Under Review |
0 |
7 |
7 |
| Does Not Trigger Investigation |
9 |
130 |
139 |
| Under Investigation |
15 |
44 |
59 |
| Voluntary Compliance Undertakings |
1 |
30 |
31 |
| Price Hearings |
0 |
2 |
2 |
Monitoring and Evaluating the Guidelines
On January 1, 2010, the Board's new revised Guidelines came into force, providing direction to patentees and Board Staff on the application of factors set out in the Patent Act and the Patented Medicines Regulations to determine if the price of a patented drug product sold in Canada is excessive.
Since then, the PMPRB has been monitoring and evaluating the application and impact of the changes to the Guidelines on an ongoing basis to ensure that they remain relevant and effective. In June 2011, the PMPRB published the Monitoring and Evaluation Plan for the Major Changes to the Guidelines. The Board was presented with the second annual assessment under this Plan in December 2012, and a table summarizing the results was published in January 2013.
A revised version of the Guidelines, reflecting all changes is released annually in June.
Voluntary Compliance Undertakings and Hearings
In 2012 and up to May 31, 2013, 15 VCUs were approved to reduce the price of patented drug products to a non-excessive level.
In addition to price reductions, excess revenues totaling $39.8 million were offset by way of payments to the Government of Canada through VCUs and Board Orders in 2012 up to May 31, 2013.
The Board issued one Notice of Hearing in 2012, in the matter of Galderma Canada Inc. and the medicine Tactuo. The Hearing Panel accepted a Voluntary Compliance Undertaking and issued a Board Order in April 2013, concluding the matter.
In 2012, the Board issued decisions and/or orders effectively completing 3 three matters: Copaxone (redetermination) on price; Pentacel and Quadracel on remedy; and Sandoz Canada Inc., on failure to file. Two matters remain before the Board: Apotex Inc. and Apo-Salvent CFC Free.
Matters Before the Federal Court
Three Board decisions are currently subject to judicial review by the Federal Court for the following: ratio-Salbutamol HFA, ratiopharm Inc. (now Teva Canada), and Sandoz Canada Inc. The ratiopharm matters are scheduled to be heard by the Court on November 4 to 6, 2013, while the Sandoz matter has not yet been scheduled.
The Federal Court heard the Copaxone Redetermination case on February 5, 2013. The Court released its decision on April 30, 2013, allowing the Teva application, quashing the Board's February 23, 2012, decision and returning the matter to a different hearing panel of the Board for redetermination.
Since 1993, a total of 93 VCUs have been approved and 26 public hearings have been initiated. Approximately $146 million have been collected through VCUs and Board Orders by way of payments to the Government of Canada and/or to customers such as hospitals and clinics.
Key Pharmaceutical Trends
Trends in Sales of Patented Drug Products
In 2012, sales of patented drug products declined to $12.8 billion from $12.9 billion in 2011, a decrease of 0.3%. By comparison, the annual growth in sales stood at 27.0% in 1999 and remained in double-digits until 2003.
Throughout the latter part of the 1990s, sales growth was largely driven by a succession of new “blockbuster” products that achieved very high sales volumes. Since that time, changes in the Canadian pharmaceutical environment, along with a reduction in the rate of introduction of new high-volume products, has resulted in decreased sales growth of patented drug products.
The decline in sales between 2011 and 2012 was the result of drug products going off-patent. The growth in new drugs along with increases in price and volume were not large enough to offset the negative effect of the exiting drugs (drugs whose patents expired and were no longer under the PMPRB's jurisdiction).
In 2003, patented drug products as a share of all drug sales was 72.7%. The share gradually declined to 56.0% in 2010, implying that sales of generic and non-patented branded drug products grew faster than sales of patented drug products. In the last two years, the share increased slightly to 58.6% in 2011 and 59.3% in 2012.
Drugs in the cardiovascular system and the blood and blood forming organs therapeutic classes accounted for the greatest decrease in sales, while those in the antineoplastic and immunomodulating agents class accounted for the greatest increase.
Annual Rate of Change, Patented Medicines Price Index (PMPI) and Consumer Price Index (CPI), 1988-2012
(Figure 4 of the full Annual Report)
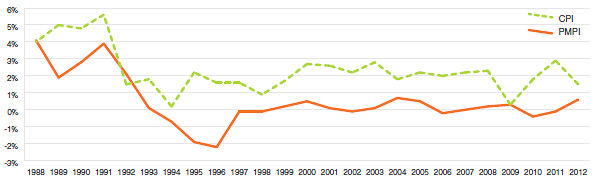
Sources: PMPRB; Statistics Canada
Price Trends
The PMPRB uses the Patented Medicines Price Index (PMPI) to monitor trends in prices of patented drug products sold in Canada. The PMPI measures the average year-over-year change in the ex-factory prices using a formula that takes a sales-weighted average of price changes observed at the level of individual products, similar to the approach used to calculate the Consumer Price Index (CPI). The PMPI has been consistently below the CPI.
As measured by the PMPI, prices of patented drug products increased slightly, on average, by 0.6% between 2011 and 2012. The CPI for the same period was 1.5%.
The average rates of price change by class of customer were obtained by applying the PMPI methodology separately to sales data for hospital, pharmacy and wholesale customers. The 2012 rates of price change for these classes were, respectively, -1.2%, -0.8% and 1.3%.
International Comparisons
The Act and Regulations require patentees to report publicly available ex-factory prices of their patented drug products for seven foreign comparator countries: France, Germany, Italy, Sweden, Switzerland, the United Kingdom, and the United States. The PMPRB uses this information to conduct its international price comparison tests.
Price Change by Country
In 2012, the United States saw prices rise on average at a rate of 11.3%. The UK saw a much more modest average price increase of 0.8%, while Germany saw no change. Prices in France, Italy, Sweden and Switzerland declined (-5.0%, -1.7%, -4.9% and -4.8%, respectively).
Price Level by Country
On an annual basis, the PMPRB conducts bilateral and multilateral price comparisons for each of the seven comparator countries using market exchange rates for currency conversion.
As in previous years, in 2012, Canadian prices were typically within the range of prices observed among the comparator countries. Results indicate that Canadian prices were roughly in line with Swiss prices (1% higher). Prices in France, Italy, the UK and Sweden were appreciably lower than Canadian prices (24%, 20%, 20%, and 10%, respectively). Prices in Germany were somewhat higher (11%), while in the United States, prices were appreciably higher than in Canada (102%).
Average Foreign-to-Canadian Price Ratios: 2005, 2012
(Figure 9 of the full Annual Report)
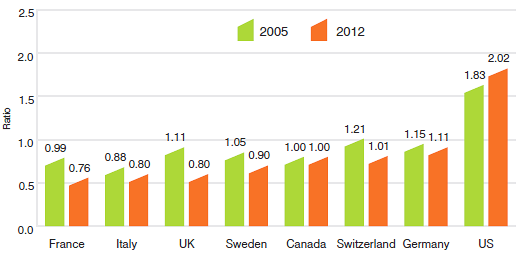
Source: PMPRB
The median international price (MIP), the median of prices observed among the seven comparator countries, is one of the measures used in multilateral price comparisons. The average MIP-to-Canadian price ratio stood at 1.07 in 2012. This indicates that the median price of patented dug products in the seven comparator countries was 7% higher than Canadian prices last year. Since 2006, the ratio has remained somewhat consistent, ranging between 1.07 and 1.03.
Canadian Drug Expenditures in the Global Context
Based on global sales data provided by MIDAS©, 2005−20121, the Canadian market accounted for 2.6% of the global market in 2012. The Canadian share has remained between 2.4% and 2.7% from 2005 to 2012.
During that same time period, drug sales in Canada rose at an annual average rate of approximately 4.0%. Drug sales among the seven comparator countries rose at an annual average rate of 3.3% over the same period.
Distribution of Drug Sales Among Major National Markets, 2012
(Figure 13 of the full Annual Report)
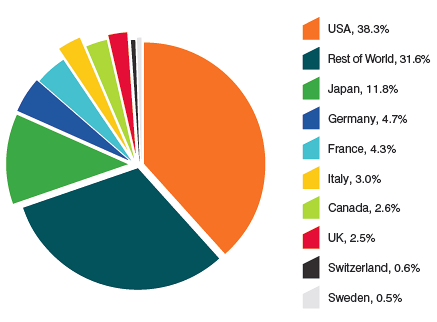
Source: MIDAS©, 2005-20121
1 Although based in part on data obtained under license from the MIDAS IMS database, the statements, findings, conclusions, views and opinions expressed in this Annual Report are exclusively those of the PMPRB and are not attributable to IMS AG.
R&D Expenditures
Patentees reported total 2012 sales revenues of $16.8 billion, a decrease of 5.8% from 2011. Sales revenues reported by Rx&D members were $11.9 billion, accounting for 71.0% of the total.
Patentees reported R&D expenditures of $894.8 million in 2012, a decrease of 9.8% over 2011. Rx&D members reported R&D expenditures of $782.8 million in 2012, a decrease of 13.1% over last year. Rx&D members accounted for 87.5% of all reported R&D expenditures in 2012.
When the Act was amended in 1987, Rx&D members made a public commitment to increase their annual research and development expenditures to 10% of sales revenues by 1996. This level of R&D expenditure was obtained by 1993. However, since 2003, R&D-to-sales ratios for all patentees and for Rx&D members have been declining. In 2012, the ratio of R&D expenditures to sales revenues for all patentees was 5.3%, down from 5.6% in 2011. These values are close to figures last observed in 1988. The overall R&D-to-sales ratio has been less than 10% for the past 12 consecutive years. The ratio for members of Rx&D was 6.6%, down from 6.7% in 2011. This is the lowest value recorded since a ratio of 6.5% was recorded in 1988, the first year the PMPRB began reporting on these figures. The Rx&D ratio has been less than 10% for the past 10 consecutive years.
Patentees reported spending $114.6 million on basic research in 2012, representing 13.2% of current R&D expenditures and a decline of 30.5% over the previous year. Patentees reported spending $520.9 million on applied research, representing 60.2% of current R&D expenditures. Clinical trials accounted for 69.4% of applied research expenditures.
Compared to the PMPRB's seven comparator countries, in 2010 Canada's R&D-to-sales ratio was second lowest at 6.9%, ahead of only Italy. Ratios in all other comparator countries were well above Canada's. On average, the R&D-to-sales ratio for all comparator countries was 22.5%.
R&D-to-Sales Ratio, Pharmaceutical Patentees, 1988-2012
(Figure 18 of the full Annual Report)
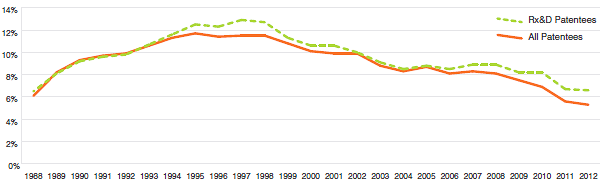
Source: PMPRB
R&D-to-Sales Ratio, Canada and Comparator Countries
(Figure 20 of the full Annual Report)
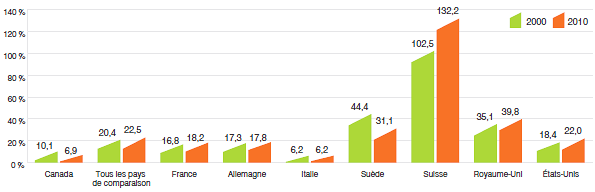
Source: PMPRB, European Federation of Pharmaceutical Industries and Associations (EFPIA): The Pharmaceutical Industry in Figures 2012, PhRMA 2012 profile
There does not appear to be any correlation between drug product prices and R&D expenditures. For example, both the United Kingdom and France have significantly lower prices than Canada with much higher levels of R&D investment. Increasingly, the impact of the prices of medicines on companies' decisions on where to locate investment or conduct research is being questioned. Other factors such as where companies can find the best science base at reasonable cost, taxation incentives, flexible labour markets and economic stability are seen as being important.
National Prescription Drug Utilization Information System
Through the National Prescription Drug Utilization Information System (NPDUIS), the PMPRB and the Canadian Institute for Health Information work with their federal/provincial/territorial government partners to provide critical analyses of price, utilization and cost trends. In 2012, the PMPRB worked closely with its partners to support drug plan policy decision making.
The latest NPDUIS reports released are the New Drug Pipeline Monitor – Fourth Edition and The Use of Blood Glucose Test Strips in Select Public Drug Plans, 2008.