ISSN: 1495-0561
Catalogue number: H78E-PDF
PDF version (4.10 MB)
Statistical Highlights 2014
Regulatory Mandate
- 1,363 patented drug products for human use were reported to the PMPRB, including 103 new drug products.
Up to May 31, 2015:
- 5 Voluntary Compliance Undertakings were accepted.
- $2.79 million in excess revenues were offset by way of payment to the Government of Canada, in addition to price reductions.
- 1 Notice of Hearing was issued in the matter of the price of Soliris.
Reporting Mandate
Sales Trends:
- There were $13.7 billion in sales of patented drug products in Canada in 2014, an increase of 3.1% from 2013.
- 59.6% of the total drug sales in Canada were for patented drug products, a decrease from 60.7% in 2013.
Price Trends:
- Prices of patented drug products were stable, while the Consumer Price Index rose by 2.0%.
- Canadian prices were 3rd highest among the seven PMPRB comparator countries, lower than prices in Germany and the US.
Research and Development (R&D):
- $739.2 million in total R&D expenditures were reported by patentees, a decrease of 1.8% over 2013.
- $658.7 million in R&D expenditures were reported by Rx&D members, an increase of 1.0% over 2013.
R&D-to-sales ratios decreased in 2014:
- 4.4% for all patentees, down from in 4.5% in 2013
- 5.0% for Rx&D members, down from 5.4% in 2013
Letter to the Minister
November 16, 2015
The Honourable Jane Philpott, MP
Minister of Health
House of Commons
Ottawa, Ontario
K1A 0A6
Dear Minister:
I have the pleasure to present to you, in accordance with sections 89 and 100 of the Patent Act, the Annual Report of the Patented Medicine Prices Review Board for the year ended December 31, 2014.
Yours very truly,
Mary Catherine Lindberg
Chairperson
Chairperson’s Message
I am pleased to present the PMPRB’s 2014 Annual Report. This year we have updated our format, adopting a more user-friendly design highlighting the PMPRB activities and emphasizing important trends.
As Canadians, we find ourselves facing tough questions of how best to ensure continuing access to cost-effective drugs. Our population is aging just as a wave of promising new high-cost drugs are entering the market, adding strain to already stretched health-care budgets and forcing payers to make increasingly difficult choices.
The Patented Medicine Prices Review Board (PMPRB), a consumer protection agency with a dual regulatory and reporting mandate, plays a unique role in this evolving landscape. The PMPRB’s regulatory mandate is to ensure that the prices of patented medicines sold in Canada are not excessive. Its reporting mandate is to provide stakeholders with information on the latest trends in pharmaceutical sales and pricing and on pharmaceutical research and development (R&D) spending in Canada.
In terms of its regulatory mandate, during the 2014 reporting period, the PMPRB entered into Voluntary Compliance Undertakings (VCUs) following investigations into the pricing of five patented medicines, resulting in $2.8 million in excess revenues being paid to the Government of Canada by pharmaceutical patentees. In 2014, the PMPRB also commenced a hearing into the price of the patented medicine Soliris, the first such proceeding since 2012.
In terms of its reporting mandate, in addition to the publication of its Annual Report, in 2014, the PMPRB published the inaugural edition of its NPDUIS annual CompassRx report. This flagship report is the first of its kind to identify major drivers behind changes in prescription drug expenditures in public plans in Canada. The information contained in this report, along with other NPDUIS studies, will assist pharmaceutical payers and policy makers in making informed reimbursement and pricing choices. Through its unbiased reporting, the PMPRB is contributing to the broader discussion, preparing Canadians, from drug plan managers to consumers, for important decisions that lie ahead.
Canada and the European Union have reached a complete text of the Comprehensive Economic and Trade Agreement (CETA). Its implementation will require amendments to the Patent Act to provide pharmaceutical patentees with up to two years of additional market exclusivity. Such a change would come at a time of high drug prices and record low R&D, causing some to question the effectiveness of the PMPRB and whether a policy balance conceived over 25 years ago continues to serve its intended purpose. In light of these questions, in 2014 the Board initiated a year-long strategic planning process in an effort to chart a fresh course for the next quarter century that would see the PMPRB reaffirm its consumer protection origins. The strategic priorities that resulted from that effort are set out in the PMPRB’s 2015–2018 Strategic Plan. As I embark on my fifth and final year as Chairperson of the PMPRB, and tenth as a Board member, I am confident that the careful execution of these priorities in the coming years will enable the PMPRB to build on its prior successes and emerge from this period stronger and more effective than at any time in its almost three decade-long history.
Mary Catherine Lindberg
About the Patented Medicine Prices Review Board: Acting in the Interest of Canadians
The PMPRB was created in 1987 as the consumer protection “pillar” of Bill C-22, legislation which also strengthened the patent rights of pharmaceutical manufacturers in order to spur investment in research and development (R&D) in Canada.
The PMPRB protects consumers by regulating the price of patented drugs at the factory gate level and by keeping a vigilant eye on pricing trends and industry R&D. Through our reporting function, we serve as an objective, centralized source of information on pharmaceutical trends for policy makers, drug companies, private insurers and other stakeholders.
We are an Independent Agency
that administers provisions of Canada’s Patent Act related to patented medicines. As a member of the Health Portfolio, we contribute to a sustainable health-care system for all Canadians.
1,363 Patented Drug Products
1,363 patented drug products were reported to the PMPRB in 2014.
The Patented Medicine Prices Review Board (PMPRB) is an independent, quasi-judicial body established by Parliament in 1987 under the Patent Act (Act).
The PMPRB is a consumer protection agency with a dual regulatory and reporting mandate. Through its regulatory mandate, it ensures that the prices of patented medicines sold in Canada are not excessive. The PMPRB also reports on trends in pharmaceutical sales and pricing for all medicines and on research and development (R&D) spending by patentees. In particular, through the National Prescription Drug Utilization Information System (NPDUIS) initiative, the PMPRB provides pharmaceutical payers and policy makers with information to make rational, evidence-based reimbursement and pricing decisions.
Protecting Consumers in a Complex Marketplace
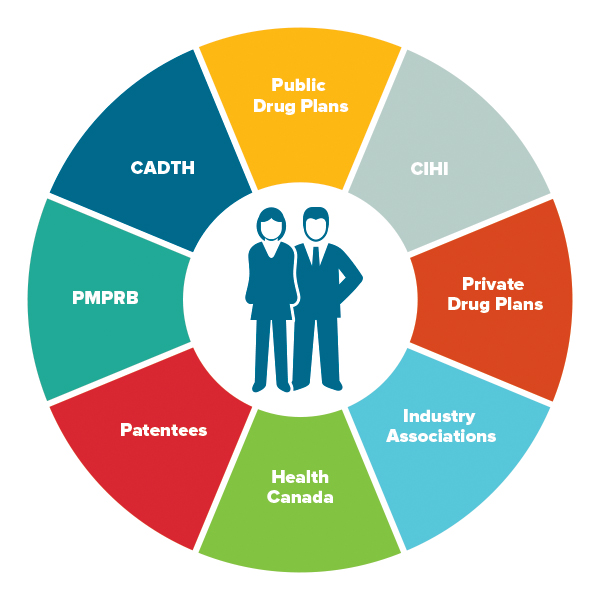
Figure description
Canadian consumers are symbolically represented by a graphic of a generic male and female in the centre of a segmented circle. Each segment of the circle represents an organization or category of organizations that are part of the Canadian pharmaceutical environment: Public Drug Plans; CIHI; Private Drug Plans; Industry Associations; Health Canada; Patentees; PMPRB; CADTH.
The PMPRB is part of the Health Portfolio, which includes Health Canada, the Public Health Agency of Canada, the Canadian Institutes of Health Research and the Canadian Food Inspection Agency. The Health Portfolio supports the Minister of Health in maintaining and improving the health of Canadians.
Although part of the Health Portfolio, because of its quasi-judicial responsibilities, the PMPRB carries out its mandate at arm's length from the Minister of Health, who is responsible for the sections of the Act pertaining to the PMPRB. It also operates independently of other bodies such as Health Canada, which approves drugs for marketing in Canada based on their safety, efficacy and quality; federal, provincial and territorial public drug plans, which approve the listing of drugs on their respective formularies for reimbursement purposes; and the Common Drug Review, administered by the Canadian Agency for Drugs and Technologies in Health, which recommends drugs that should qualify for reimbursement by participating public drug plans.
The PMPRB is composed of Board Staff, who are public servants responsible for carrying out the organization’s day to day work, and Board members, Governor-in-Council appointees who serve as panel members in the event of a dispute between Board Staff and a patentee over the price of a patented medicine.
Jurisdiction
Regulatory
The PMPRB regulates the "factory gate" prices for all patented drug products in Canadian markets; that is, the prices at which patentees (companies) sell their products to wholesalers, hospitals, pharmacies and other large distributers. The PMPRB has no jurisdiction over prices charged further along the supply chain, e.g., wholesale prices or retail prices charged by pharmacies, nor does it have the authority to regulate the prices of non-patented drugs.
The Board's jurisdiction is not limited to drug products for which the patent is on the active ingredient. Rather, the Board's jurisdiction also covers drugs for which the patents relate to, but are not limited to, the processes of manufacture, the delivery system or dosage form, the indication/use and any formulations.
Under the Act, patentees are required to inform the PMPRB of their intention to sell a new patented drug product. Upon the sale of a patented drug product, patentees are required to file price and sales information at introduction and, thereafter, until all patents pertaining have expired. Although patentees are not required to obtain approval of the price before a drug is sold, they are required to comply with the Act to ensure that the prices of patented drug products sold in Canada are not excessive.
Board Staff reviews the prices that patentees charge for each individual strength and form of a patented drug product. If Staff believes that the price of a patented medicine is excessive, it will first try to reach a consensual resolution with the patentee. Failing this, the Chairperson can hold a hearing on the matter. At the hearing, a panel composed of Board members acts as a neutral arbiter between Board Staff and the patentee. If a panel finds that the price of a patented medicine is excessive, it can order a reduction of the price to a non-excessive level. It can also order a patentee to offset any excess revenues and, in cases where the panel determines there has been a policy of excessive pricing, it can double the amount to be offset.
Reporting
The PMPRB reports annually to Parliament through the Minister of Health on its price review activities, the prices of patented medicines and price trends of all prescription drugs, and on the research and development (R&D) expenditures reported by pharmaceutical patentees, as required by the Act.
Through the National Prescription Drug Utilization Information System (NPDUIS) initiative, established by the federal, provincial and territorial (F/P/T) Ministers of Health in 2001, the PMPRB conducts critical analyses of price, utilization and cost trends for patented and non-patented prescription drugs. This program provides F/P/T governments and other interested stakeholders with a centralized, credible source of information on pharmaceutical trends.
Governance
The Board consists of up to five members who serve on a part-time basis. Board Members, including a Chairperson and a Vice-Chairperson, are appointed by the Governor-in-Council. The Chairperson is designated under the Act as the Chief Executive Officer of the PMPRB, with the authority and responsibility to supervise and direct its work.
The Members of the Board, including the Chairperson, are collectively responsible for the implementation of the applicable provisions of the Act. Together, they establish the guidelines, rules and other policies of the Board as provided by the Act and consult, as necessary, with stakeholders including the provincial and territorial Ministers of Health and representatives of consumer groups and the pharmaceutical industry.
Members of the Board
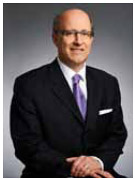
Chairperson
Mary Catherine Lindberg, BSP

Mary Catherine Lindberg was first appointed Member and Vice-Chairperson of the Board in June 2006. On May 19, 2010, Ms. Lindberg assumed the powers and functions of the Chairperson while the office was vacant. She was officially appointed Chairperson of the Board on March 3, 2011.
From 2002 to 2009, Ms. Lindberg was Executive Director of the Ontario Council of Academic Hospitals, an organization of 25 Academic Hospitals that are fully affiliated with a university and its Faculty of Medicine. Previously, she was the Assistant Deputy Minister, Health Services, with the Ontario Ministry of Health and Long-Term Care. Her responsibilities included the Ontario Health Insurance Plan (OHIP) and the Ontario Drug Programs.
Ms. Lindberg has a degree in pharmacy from the University of Saskatchewan and holds a pharmacist license in both Saskatchewan and Ontario.
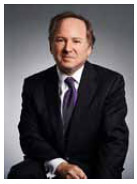
Vice-Chairperson
Mitchell Levine, BSc, MSc, MD, FRCPC, FISPE, FACP
Dr. Mitchell Levine was appointed Member and Vice-Chairperson of the Board on March 3, 2011.
Dr. Levine is a professor in the Department of Clinical Epidemiology & Biostatistics and the Department of Medicine, Division of Clinical Pharmacology in the Faculty of Health Sciences at McMaster University in Hamilton, Ontario. He is also Director of the Centre for Evaluation of Medicines at St. Joseph's Healthcare in Hamilton.
Dr. Levine received his medical degree from the University of Calgary and did postgraduate medical training in Internal Medicine and in Clinical Pharmacology at the University of Toronto. He received an MSc degree in Clinical Epidemiology from McMaster University in 1988. He is a practicing consultant physician in Hamilton, Ontario.
Prior to his appointment to the Board, Dr. Levine had been a member of the PMPRB's Human Drug Advisory Panel. He presently acts, on an ad hoc basis, as a clinical pharmacology consultant to the Ontario Ministry of Health and Long-Term Care. He is the Editor-in-Chief of the Journal of Population Therapeutics And Clinical Pharmacology and the Canadian Journal of General Internal Medicine.
Members
Normand Tremblay, ASC, MSc, Adm.A., CMC

Normand Tremblay was appointed Member of the Board on May 31, 2012.
Mr. Tremblay teaches at the Université du Québec in the area of management, project management and innovation. He brings to the Board a vast experience and expertise in strategic and operational planning and organizational development. For over 20 years, Mr. Tremblay has been active in various areas of the business field, both nationally and internationally. He has also sat on investment committees and a number of administrative boards, including the National Research Council of Canada from 2007 to 2010.
Mr. Tremblay holds a master’s degree in project management (MSc) with a specialization in best practices in product development from the Université du Québec à Trois-Rivières as well as a certificate in business governance from Laval University (2009), and is a Certified Management Consultant. He is also a member of the Order of Certified Administrators of Québec.
Richard Bogoroch, LL.B.
Richard Bogoroch was appointed Member of the Board on December 13, 2012.
Richard M. Bogoroch is the founder and Managing Partner of Bogoroch & Associates LLP, the successor to Bogoroch and Associates, a Toronto-based law firm established in November 1999 that specializes in civil litigation. Bogoroch & Associates LLP concentrates on serious personal injury litigation, wrongful death litigation, medical malpractice litigation, products liability and disability claims litigation.
Mr. Bogoroch graduated from McGill University with a B.C.L. in 1978 and a LL.B in 1979. He was admitted to the Alberta Bar in 1980 and called to the Ontario Bar in 1983. Richard completed his articles at Thomson Rogers and in 1983 joined the firm upon his call to the Bar. In 1993, he was certified by The Law Society of Upper Canada as a Specialist in Civil Litigation. From 1987 to 1999, he was a partner at Thomson Rogers. Mr. Bogoroch is a past Director of the Ontario Centre for Advocacy Training and a past Director of the Advocates' Society. He is also a past Chairman of the Canadian Bar Association – Ontario Provincial Committee on the Judiciary. Mr. Bogoroch has lectured and written extensively on many aspects of personal injury litigation for Continuing Legal Education Programmes organized by The Advocates' Society, The Law Society of Upper Canada, the Ontario Bar Association, the Ontario Trial Lawyers Association, The Canadian Institute, Osgoode Hall Law School's Professional Development Programme, Insight and others. Since 1999 he has also been a guest instructor at the Intensive Trial Advocacy Workshop at Osgoode Hall Law School. From 2011 to 2014, he has chaired or co-chaired Osgoode Professional Development's annual programme on personal injury litigation. Since 2011, he has co-chaired the Advocates' Society "Tricks of the Trade Programme", its annual continuing legal education programme on personal injury litigation.
Mr. Bogoroch has been recognized by LEXPERT as a Leading Practitioner in Personal Injury Law and was listed in "Best Lawyers" for Personal Injury Litigation.
Carolyn Kobernick, B.C.L., LL.B.

Carolyn Kobernick was appointed Member of the Board on June 13, 2014.
Carolyn Kobernick is a lawyer and former career public servant. Prior to her retirement in 2013, Ms. Kobernick had been Assistant Deputy Minister of Public Law for the Department of Justice since 2006. As principal counsel to the Minister of Justice and Attorney General of Canada, Ms. Kobernick was instrumental in the development and delivery of policy for the Public Law sector. In addition to identifying key strategic, legal and operational matters, she tackled cross-cutting national issues as the liaison between the Department of Justice and other government organizations.
Ms. Kobernick joined the Department of Justice in 1980 where she practiced litigation and tax law at the Toronto Regional office. In 1991 she was appointed Senior General Counsel, Deputy Head, Business and Regulatory Law Portfolio, after working for over a decade in the legal services unit of the Correctional Service of Canada. In her role as Senior General Counsel, Ms. Kobernick was involved in complex policy and operational issues affecting the Government of Canada, including the Alaska Pipeline and Mackenzie Valley Pipeline files and the Sponsorship file.
During her career with the public service, Ms. Kobernick actively participated in many high-profile initiatives. She was Chair of the National Legal Advisory Committee and Departmental Champion for Aboriginal People and Gender Equity, and was appointed Senior Legal Advisor to the Government of Canada for the 2004 Gomery Inquiry.
Ms. Kobernick holds a B.C.L. and L.L.B. from McGill University and is a member of the bar of Ontario. In 2012 she obtained a Certificate in Adjudication for Administrative Agencies Boards and Tribunals from the Osgoode Hall Law School and The Society of Adjudicators and Regulators.
Organizational Structure and Staff
PMPRB Organizational Chart
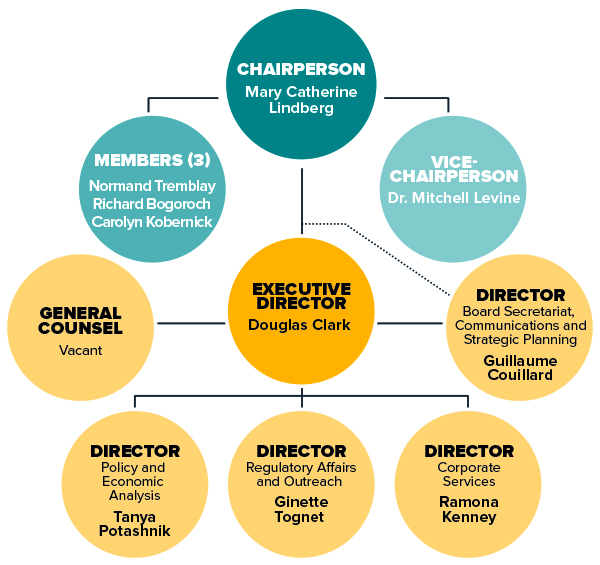
Figure description
This organizational chart illustrates the high-level reporting structure within the PMPRB, and lists the current Board and Senior Staff members. Board: Chairperson—Mary Catherine Lindberg; Vice-Chairperson—Dr. Mitchell Levine; Members—Normand Tremblay, Richard Bogoroch, and Carolyn Kobernick. Senior Staff: Executive Director—Douglas Clark; General Counsel—position is vacant; Director Board Secretariat, Communications and Strategic Planning—Guillaume Couillard; Director Policy and Economic Analysis—Tanya Potashnik; Director Regulatory Affairs and Outreach—Ginette Tognet; Director Corporate Services—Ramona Kenney.
Executive Director
The Executive Director is responsible for advising the Board and for the leadership and management of the Staff.
Regulatory Affairs and Outreach
The Regulatory Affairs and Outreach Branch reviews the prices of patented drug products sold in Canada to ensure that they are not excessive; encourages patentees to comply voluntarily with the Board's Guidelines; implements related compliance policies; and investigates complaints into the prices of patented medicines. This Branch also informs and educates patentees on the Board's Guidelines and filing requirements.
Policy and Economic Analysis
The Policy and Economic Analysis Branch provides advice on PMPRB policy issues, including recommendations on possible changes to the Board's Guidelines. It conducts research and economic analysis on pharmaceutical trends, and provides information to support both compliance and enforcement. Through the NPDUIS initiative, it provides targeted analyses of drug price, utilization and cost trends to support public drug plan managers and other key decision makers in Canada.
Corporate Services
The Corporate Services Branch provides advice and services relating to human resources management; facilities; health, safety and security; information technology; and information management. It is also responsible for financial planning and reporting, audit and evaluation, and liaising with federal central agencies on these topics.
Board Secretariat, Communications and Strategic Planning
The Board Secretariat, Communications and Strategic Planning Branch develops and manages the PMPRB's communications program, media relations, public enquiries and the formal complaints process; manages the Board's meeting and hearing processes, including the official record of proceedings; and coordinates activities pursuant to the administration of the Access to Information Act and the Privacy Act. It is also responsible for strategic planning and reporting.
General Counsel
The General Counsel advises the PMPRB on legal matters and leads the prosecution team in proceedings before the Board.
Budget
In 2014/15, the PMPRB had a budget of $10.927 million and an approved staff level of 73 full-time equivalent employees.
Table 1. Budget and Staffing
|
2013/14 |
2014/15 |
2015/16 |
| Budget |
$10.944 M |
$10.927 M |
$10.945 M |
| Salaries |
$6.920 M |
$6.903 M |
$6.937 M |
| Operating |
$1.554 M |
$1.554 M |
$1.538 M |
| Special Purpose Allotment* |
$2.470 M |
$2.470 M |
$2.470 M |
| Full Time Employees (FTEs) |
74 |
73 |
71 |
* The Special Purpose Allotment is reserved strictly for external costs of public hearings (legal counsel, expert witnesses, etc.). Any unspent funds are returned to the Consolidated Revenue Fund.
Communications and Outreach
The Communications Program is responsible for planning and managing the PMPRB's external and internal communications activities. One of its goals is to generate meaningful dialogue between government, industry stakeholders, Canadian consumers and the media on pharmaceutical issues, and to strengthen the PMPRB’s relationships with these groups.
To that end, the Communications Program is taking a more proactive approach to its media presence. Over the past year, this included a greater use of press releases and engagement with media outlets generally. In addition, the PMPRB revamped its website, increased its use of social media and developed new publication products targeting a more general audience. It continued to respond to public enquiries and inform the public through publishing updates of Board proceedings and decisions, and research results.
The PMPRB is committed to ensuring that industry stakeholders are consulted and informed of changes in the operating environment and are promptly advised of any updates to the regulatory process. Over the past year, the Regulatory Affairs and Outreach Branch continued to provide regular outreach sessions for patentees, reorganized the web pages relevant to patentees and created its first instructional video.
Publications
The PMPRB is a reliable, impartial source of comprehensive information on drug prices and trends. In addition to regular publications, such as the Annual Report and the quarterly NEWSletter, the PMPRB publishes the results of analytical studies including NPDUIS research papers.
This year, the PMPRB committed to publishing an Analysis Brief in conjunction with the release of each new NPDUIS report to highlight the main findings of the study for a more general audience. The PMPRB also organized a researchers’ forum with academics and policy experts to discuss current research into pharmaceutical use in Canada and emerging areas for future study.
Regulating Prices of Patented Medicines: Continued Vigilance Necessary
With the population aging and using more prescription drugs—and sometimes more expensive types of drugs—Canada’s spending on pharmaceuticals is expected to increase significantly in the years to come. Medical advancements have introduced many innovative new drugs to the Canadian marketplace to improve existing treatments and to treat conditions that previously had no pharmaceutical therapy. These include high-cost orphan drugs, biologics and cancer drugs. The PMPRB plays an important role in regulating the prices of new and existing patented drug products to ensure the sustainability of the Canadian health-care system.
2% of New Drugs were Breakthrough Drugs
Since 2010, approximately 2% of new drugs reported to the PMPRB were catagorized as breakthrough drugs.
A breakthrough drug product is defined as the first drug product to be sold in Canada that effectively treats a particular illness or effectively addresses a particular indication.
61 Investigations
In 2014, there were 61 investigations into excessive drug pricing.
As a result of PMPRB investigations, five Voluntary Compliance Undertakings were accepted (up to May 31, 2015), with over $2.7 million in excess revenues offset by way of payment to the Government of Canada.
Notice of Hearing
Pending Hearing on the Patented Medicine Soliris
In January 2015, a Notice of Hearing was issued to determine whether the patented medicine Soliris, a high-cost “orphan” drug, is excessively priced in Canada. Proceedings are ongoing.
The PMPRB protects the interests of Canadian consumers by ensuring that the prices of patented medicines sold in Canada are not excessive. It does this by reviewing the prices that patentees charge for individual patented drug products to wholesalers, hospitals and pharmacies and by taking action against patentees to reduce prices and pay back excess revenues where appropriate.
Reporting Requirements
Patentees are required by law to file information pertaining to the sale of their drug products in Canada. The Patent Act (Act) along with the Patented Medicines Regulations (Regulations) set out the filing requirements, and Board Staff reviews the pricing information on an ongoing basis to ensure that the prices are not excessive until all patents pertaining have expired.
There are several factors used for determining whether a drug product is excessively priced, as outlined in section 85 of the Act. The Compendium of Policies, Guidelines and Procedures (Guidelines) details the price tests used by Board Staff to determine whether the price charged by a patentee falls within the maximum allowable price. The Guidelines were developed in consultation with stakeholders including the provincial and territorial Ministers of Health, consumer groups, and the pharmaceutical industry. When an investigation determines that there is a problem with the price of a patented drug product, the patentee is offered the opportunity to voluntarily lower its price and/or refund its excess revenues through a Voluntary Compliance Undertaking (VCU). If the patentee disagrees with the results of the investigation and chooses not to submit a VCU, the Chairperson of the Board may issue a Notice of Hearing (NOH). After hearing the evidence, if the Board finds that the price is excessive, it can issue an Order to reduce the price and/or refund the excess revenues. A patentee also has the option of submitting a VCU to resolve the matter after the NOH has issued. Copies of the Act, the Regulations, the Guidelines and the Patentee’s Guide to Reporting are posted on the PMPRB’s website.
Failure to Report
The PMPRB relies on the patentees’ full and timely disclosure of any and all patented drug products being sold in Canada to which a patent pertains. In 2014, 9 drug products were reported to the PMPRB for the first time even though they were patented and sold prior to 2014. Table 2 lists the drug products that were patented and sold in Canada prior to being reported to the PMPRB.
Table 2. Failure to Report the Sale of Patented Drugs
| Currently Sold By |
Brand Name |
Generic Name |
Year Medicine Came Under
PMPRB's Jurisdiction |
| Sigma-Tau Pharmaceuticals Inc. |
Carnitor IV |
Levocarnitine |
2001 |
| Pfizer Canada Inc. |
Cytosar (3 DINs) |
Cytarabine |
2003 |
| Paladin Labs Inc. |
Metadol (3 DINs) |
Methadone hydrochloride |
2010 |
| Otuska Canada Pharmaceutical Inc. |
Samsca (2 DINs) |
Tolvaptan |
2011 |
Failure to File Price and Sales Data (Form 2)
Failure to file refers to the complete or partial failure of a patentee to comply with the regulatory filing requirements outlined in the Act and the Regulations. There were no Board Orders issued for failure to file in 2014.
Scientific Review
Human Drug Advisory Panel
All new patented drug products reported to the PMPRB are subject to a scientific evaluation as part of the price review process. The Human Drug Advisory Panel (HDAP) was established by the Board to provide independent expertise and advice to Board Staff. The Human Drug Advisory Panel conducts a review when a patentee makes a claim regarding therapeutic improvement. Panel members review and evaluate the appropriate scientific information available, including any submission by a patentee with respect to the proposed level of therapeutic improvement, the selection of drug products to be used for comparison purposes and comparable dosage regimens.
Price Review
The PMPRB reviews the average price of each strength of an individual dosage form of each patented medicine. In most cases, this unit is consistent with the Drug Identification Number (DIN) assigned by Health Canada at the time the drug is approved for sale in Canada.
New Patented Drug Products Reported to the PMPRB in 2014
For the purpose of this report, a new patented drug product in 2014 is defined as any patented drug product first sold in Canada, or previously sold but first patented, between December 1, 2013, and November 30, 2014.
There were 103 new patented drug products for human use reported as sold in 2014. Some are one or more strengths of a new active substance and others are new presentations of existing medicines. Of the 103 new patented drug products, 4 (3.9%) were being sold in Canada prior to the issuance of the Canadian patent that brought them under the PMPRB’s jurisdiction. The table below shows the year of first sale for these drug products.
Table 3. Number of New Patented Drug Products for Human Use in 2014 by Year First Sold
| Year First Sold |
Number of Drug Products |
| 2014 |
99 |
| 2013 |
1 |
| 2011 |
1 |
| 2008 |
1 |
| 2006 |
1 |
| Total |
103 |
The list of New Patented Medicines Reported to the PMPRB is available on the website under Regulating Prices. This list includes information on the status of the review (e.g., whether the medicine is under review, within the Guidelines, under investigation, or subject to a VCU or Notice of Hearing).
Figure 1 illustrates the number of new patented drug products for human use reported to the PMPRB from 1989 to 2014.
Figure 1. New Patented Drug Products for Human Use
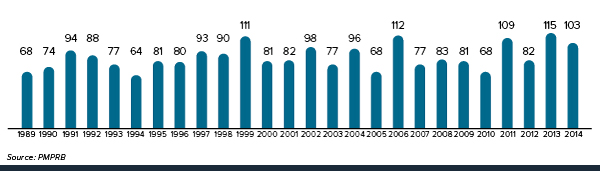
Figure description
This is a bar graph depicting the number of new patented drug products for human use reported to the Patented Medicine Prices Review Board by year. In 1989, 68 patented drug products for human use were reported to the PMPRB. In 1990: 74; 1991: 94; 1992: 88; 1993: 77; 1994: 64; 1995: 81; 1996: 80; 1997: 93; 1998: 90; 1999: 111; 2000: 81; 2001: 82; 2002: 98; 2003: 77; 2004: 96; 2005: 68; 2006: 112; 2007: 77; 2008: 83; 2009: 81; 2010: 68; 2011: 109; 2012: 82; 2013: 115; 2014: 103.
Of the 103 new patented drug products:
- the prices of 77 had been reviewed as of March 31, 2015:
- 68 were found to be within the Guidelines
- 1 was at a level that appeared to exceed the Guidelines by an amount that did not trigger the investigation criteria
- 8 were priced at levels that appeared to exceed the Guidelines and investigations were commenced
For a complete list of the 103 new patented drug products and their price review status, see Appendix 2.
Price Review of Existing Patented Drug Products for Human Use in 2014
For the purpose of this report, existing patented drug products include all patented drug products that were first sold and reported to the PMPRB prior to December 1, 2013.
At the time of this report, there were 1,260 existing patented drug products:
- 970 were priced within the Guidelines
- 226 exceeded the Guidelines by an amount that did not trigger the investigation criteria
- 53 were the subject of investigations:
- 6 were opened as the result of introductory pricing in 2012
- 7 were opened as the result of introductory pricing in 2013
- 40 were opened on the basis of year-over-year prices
- 8 were under review
- 2 drug products were the subject of Voluntary Compliance Undertakings
- 1 drug product is the subject of a hearing
- 1 additional drug product remains the subject of a hearing although no longer patented in 2014
A summary of the status of the price review of the new and existing patented drug products for human use in 2014 is provided in Table 4.
Table 4. Patented Drug Products for Human Use Sold in 2014—Status of Price Review as of March 31, 2015
|
New Drug Products Introduced in 2014 |
Existing Drug Products |
Total |
| Total |
103 |
1,260 |
1,363 |
| Within Guidelines |
68 |
970 |
1,038 |
| Under Review |
26 |
8 |
34 |
| Does Not Trigger Investigation |
1 |
226 |
227 |
| Under Investigation |
8 |
53 |
61 |
| Voluntary Compliance Undertakings |
0 |
2 |
2 |
| Price Hearings |
0 |
1 |
1 |
Update From the 2013 Annual Report
- Reviews of all drug products for human use reported as Under Review in the 2013 Annual Report have been completed.
- 44 of the 66 investigations reported in the 2013 Annual Report resulted in one of the following:
- the closure of the investigation where it was concluded that the price was within the Guidelines
- a Voluntary Compliance Undertaking (VCU) by the patentee to reduce the price and offset excess revenues through a payment and/or a reduction in the price of another patented drug product (see Voluntary Compliance Undertakings)
- a public hearing to determine whether the price was excessive, including any remedial Order determined by the Board (see Hearings)
Patented Over-the-Counter Drug Products and Patented Drug Products For Veterinary Use
Board Staff reviews the price of a patented over-the-counter drug product or a patented veterinary product when a complaint has been received. No complaints were received in 2014.
Enquiries and Formal Complaints
The PMPRB received several enquiries in 2014 regarding its regulatory activities and the compliance status of patented and non-patented drug products. Board Staff was able to confirm that the patented medicines in question were within the Guidelines. Had the price of the patented drug products been outside the Guidelines, Board Staff would have initiated an investigation.
If the price of a drug product is found to be outside the Guidelines, the patentee may submit a VCU for the Chairperson’s approval or the Chairperson may determine that it is in the public interest to hold a public hearing. Once a determination has been made in either case, the outcome is reported on the PMPRB website.
Voluntary Compliance Undertakings and Hearings
Voluntary Compliance Undertakings
A VCU is a written undertaking by a patentee to adjust its price to conform to the Board's Guidelines. Under the Guidelines, patentees are given an opportunity to submit a VCU when Board Staff concludes, following an investigation, that the price set forth by the patentee for a patented drug product sold in Canada appears to have exceeded the Guidelines. A VCU can also be submitted by a patentee after a Notice of Hearing is issued.
In 2014, four VCUs were accepted. In addition to price reductions for certain drug products, excess revenues totaling $2,728,804.38 were offset by way of payments to the Government of Canada.
In 2015, to date, one VCU was approved by the Chairperson in the Crixivan matter.
Patentees are to ensure that the prices of their patented drug products are within the Board’s Guidelines during all periods in which the drug products are under the PMPRB’s jurisdiction.
Table 5. Voluntary Compliance Undertakings in 2014 up to May 31, 2015
| Patented Drug Product |
Therapeutic Use |
Patentee |
Date of Approval |
Price Reduction |
Payment to the Government |
| VCUs in 2014 |
| Gonal F (3 drug products) |
Stimulation of multiple follicular development in ovulatory patients undergoing Assisted Reproductive Technologies (ART) |
EMD Inc. |
June |
blank |
$1,667,002.48 |
| Lamisil (1 drug product) |
Treatment of fungal infections of the skin and nails |
Novartis Pharmaceuticals Canada Inc. |
June |
blank |
$425,034.25 |
| Lodalis (1 drug product) |
Reduction of cholesterol blood level |
Valeant Canada LP |
September |
blank |
$63,119.56 |
| Gelnique (1 drug product) |
Treatment of overactive bladder |
Actavis Specialty Pharmaceutical Co. |
November |
✔ |
$573,648.09 |
| Total |
|
|
|
|
$2,728,804.38 |
| VCUs in 2015, up to May 31 |
| Crixivan (1 drug product) |
Treatment of HIV infection |
Merck Canada Inc. |
April |
blank |
$58,917.68 |
| Overall total |
|
|
|
|
$2,787,722.06 |
Hearings
In the event that the price of a patented medicine appears to be excessive, the Board can hold a public hearing. If it finds that the price is excessive, it may issue an order to reduce the price and to offset revenues received as a result of the excessive price. Board decisions may be subject to judicial review in the Federal Court of Canada.
In January 2015, the Patented Medicine Prices Review Board announced it would hold a public hearing in the matter of the price of the patented medicine Soliris, and Alexion Pharmaceuticals Inc., the pharmaceutical company that holds the patent for Soliris and sells the medicine in Canada. Soliris is the first and only treatment for patients with Paroxysmal Nocturnal Hemoglobinuria—a rate and life-threatening blood disorder. The purpose of this hearing will be to determine whether the medicine has been or is being sold in any market in Canada at a price that, in the Board's opinion, is or was excessive; and, if so, what order, if any, should be made to remedy the excessive pricing.
Two other matters remain before the Board: Apotex Inc. and Apo-Salvent CFC Free. The outcome of these matters will be examined in light of the Federal Court decisions into three other matters: ratio-Salbutamol HFA, ratiopharm and Sandoz on the Board’s jurisdiction. Those decisions are under review in the Federal Court of Appeal.
Table 6. Status of Board Proceedings in 2014 up to May 31, 2015
| Patented Drug Product |
Therapeutic Use |
Patentee |
Issuance of Notice of Hearing |
Status |
| Apo-Salvent CFC-Free |
Asthma |
Apotex Inc. |
July 8, 2008 |
Ongoing |
| ratio-Salbutamol HFA |
Asthma |
ratiopharm Inc.
(now Teva Canada) |
July 18, 2008 |
Judicial review heard by the Federal Court: Nov. 4–6, 2013; decision issued May 27, 2014
Notice of Appeal filed at the Federal Court of Appeal: June 25, 2014 |
| Soliris |
Paroxysmal nocturnal hemoglobinuria
Atypical hemolytic uremic syndrome |
Alexion Pharmaceuticals Inc. |
January 20, 2015 |
Ongoing
Notice of Hearing issued:
January 22, 2015 |
Blank
| Patentee |
Issue |
Date of Notice of Application |
Status |
| Apotex Inc. |
Failure to file (jurisdiction) |
March 3, 2008 |
Ongoing |
ratiopharm Inc.
(now Teva Canada) |
Failure to file
( jurisdiction) |
August 28, 2008 |
Judicial review heard by the Federal Court Nov. 4–6, 2013; decision issued May 27, 2014
Notice of Appeal filed at the Federal Court of Appeal: June 25, 2014 |
| Sandoz Canada Inc. |
Failure to file ( jurisdiction) |
March 8, 2010 |
Judicial review heard by the Federal Court: Nov. 19–20, 2013; decision issued: May 27, 2014
Notice of Appeal filed at the Federal Court of Appeal: June 25, 2014 |
Summary
Excess revenues totalling $2,787,722.06 were offset by way of payments to the Government of Canada through VCUs and Board Orders in 2014 up to May 31, 2015.
Since 1993, a total of 100 VCUs have been approved and 27 public hearings initiated. These measures resulted in price reductions and the offset of excess revenues by way of additional price reductions and/or payments to the Government of Canada. Over $149 million has been collected through VCUs and Board Orders by way of payments to the Government of Canada and/or to customers such as hospitals and clinics.
Matters Before the Federal Court of Appeal
Three Board decisions had been subject to judicial review by the Federal Court: ratio-Salbutamol HFA (T-1058-11; T-1825-11); ratiopharm Inc. (now Teva Canada) (T-1252-11); and Sandoz Canada Inc. (T-1616-12). The Court heard these matters in November 2013 and released its decisions on May 27, 2014. The Federal Court allowed the applications for judicial review and referred the matters back to the Board with a direction that it find that ratiopharm Inc. and Sandoz Canada Inc. are not patentees. Notices of Appeal for these decisions (ratiopharm Inc. (now Teva Canada) (A-303-14) and Sandoz (A-302-14)) were filed with the Federal Court of Appeal by the Attorney General on June 25, 2014.
Key Pharmaceutical Trends: Drug Sales are on the Rise
Overall spending on pharmaceuticals is influenced by many factors, including price, utilization, the market entry of newer, more expensive drugs, and older drugs “going generic”. In 2014, sales of patented drugs increased by 3.1% and Canadian prices remained third highest among the PMPRB’s comparator countries (PMPRB7).
3rd Highest Ranking in Patented Drug Prices
Patented drug prices in Canada remain the third highest among the comparator countries.
For the second year in a row, Canadian prices are higher than those in France, the UK, Italy, Sweden and Switzerland.
The Average Increase in Patented Drug Prices was Less Than the CPI
In 2014, the increase in patented drug prices was less than the rate of inflation, as measured by the consumer price index (CPI), and therefore, did not contribute to sales growth.
30.8% of Sales in 2014
Antineoplastics and immunomodulating agents had the greatest impact on sales growth in 2014.
Chemotherapy drugs and drugs that affect the immune system accounted for 30.8% of sales in 2014, an increase of 7.4% from last year.
6% Higher Prices
Canadian patented drug prices are 6% higher than the international median when US prices are excluded.
Although Canadian patented drug prices are below the international median price of the PMPRB comparator countries, if US prices are excluded from the international average, Canadian prices are, on average, 6% higher.
184.43% Increase in Total Drug Expenditures
Since 2000, growth in drug expenditures in Canada has outpaced the growth in all comparator countries.
Canadian drug expenditures increased by 184.43% between 2000 and 2012. This rate of growth was higher than that of all of the PMPRB comparator countries – even the US.
The PMPRB is responsible for reporting on trends in pharmaceutical sales and pricing for all medicines and for reporting research and development spending by patentees. In addition, the PMPRB undertakes studies and conducts analysis on a variety of topics related to pharmaceutical pricing and costs.
Trends in Sales of Patented Drug Products
Patentees are required under the Patented Medicines Regulations (Regulations) to submit detailed information on their sales of patented drug products, including quantities sold and net revenues received for each product by class of customer in each province/territory. The PMPRB uses this information to analyze trends in sales, prices and utilization of patented drug products.Footnote 1 This section provides key statistical results from this analysis.
Sales and Prices
Canadians spend much more today on patented drug products than they did a decade ago, but it is important to understand that an increase in drug spending does not in itself imply rising drug prices. For example, the PMPRB's Annual Reports from 1995 through 2003 noted that sales of patented drug products grew at annual rates consistently exceeding 10%, while average annual rates of change for prices were less than 1%. In these instances, sales growth was driven by changes in the volume and composition of drug utilization.
A variety of factors can produce such changes. These include:
- increases in total population
- changes in the demographic composition of the population (for example, shifts in the age distribution toward older persons with more health problems)
- increases in the incidence of health problems requiring drug therapy
- changes in the prescribing practices of physicians (for example, a shift away from older, less expensive drug products to newer, more expensive medications, or a shift toward higher, more frequent dosages)
- increases in the use of drug therapy instead of other forms of treatment
- the use of new drug products to treat conditions for which no effective treatment existed previously
Sales Trends
Table 7 reports patentees' total sales of patented drug products in Canada for 1990 through 2014. In 2014, sales of patented drug products increased to $13.7 billion from $13.3 billion in 2013, an increase of 3.1%. By comparison, the annual growth in sales was 27.0% in 1999 and remained in double-digits until 2003.
The last column of Table 7 gives sales of patented drug products as a share of overall drug sales. This share rose from 43.2% in 1990 to a peak of 72.7% in 2003. It declined over the 2003 to 2009 period, but has been quite stable since. That is, sales of non-patented brand and generic drug products have generally grown at similar rates as the sales of patented drug products in recent years.
Table 7. Sales of Patented Drug Products, 1990–2014
| Year |
Patented Drug Products:
Sales ($Billions) |
Patented Drug Products:
Change (%) |
Sales of Patented Drug Products
as a Share of all Drug Sales (%)* |
| 2014 |
13.7 |
3.1 |
59.6 |
| 2013 |
13.3 |
4.1 |
60.7 |
| 2012 |
12.8 |
-0.1 |
59.3 |
| 2011 |
12.8 |
3.1 |
58.6 |
| 2010 |
12.4 |
-4.3 |
56.0 |
| 2009 |
12.9 |
2.4 |
59.2 |
| 2008 |
12.6 |
2.4 |
61.7 |
| 2007 |
12.3 |
3.4 |
63.2 |
| 2006 |
11.9 |
3.5 |
67.8 |
| 2005 |
11.5 |
4.5 |
70.6 |
| 2004 |
11.0 |
7.8 |
72.2 |
| 2003 |
10.2 |
14.3 |
72.7 |
| 2002 |
8.9 |
17.5 |
67.4 |
| 2001 |
7.6 |
18.9 |
65.0 |
| 2000 |
6.3 |
16.7 |
63.0 |
| 1999 |
5.4 |
27.0 |
61.0 |
| 1998 |
4.3 |
18.9 |
55.1 |
| 1997 |
3.7 |
22.6 |
52.3 |
| 1996 |
3.0 |
12.8 |
45.0 |
| 1995 |
2.6 |
10.8 |
43.9 |
| 1994 |
2.4 |
-2.1 |
40.7 |
| 1993 |
2.4 |
9.4 |
44.4 |
| 1992 |
2.2 |
14.0 |
43.8 |
| 1991 |
2.0 |
13.1 |
43.2 |
| 1990 |
1.7 |
– |
43.2 |
* The denominator in this ratio comprises sales of patented, non-patented brand and generic drug products. Starting with the estimate for 2005, this value is derived from data contained in the IMS AG MIDAS™ database. In previous years, IMS data were used to calculate sales of generic drug products only, while sales of non-patented brand products were estimated from data submitted by patentees. This approach was abandoned because of anomalies related to year-to-year changes in the set of companies reporting to the PMPRB. Ratios reported for years before 2005 likely overstate the patented share, but by only a small amount. This small bias in no way invalidates the strong upward trend evinced by the results for the years 1990 through 2003.
Sources: PMPRB; MIDAS™ database, 2005–2014, IMS AG. All rights reserved.Footnote 2
Drivers of Sales Growth
Table 8 decomposes the sales growth that occurred between 2013 and 2014 into distinct elements reflecting the impacts of:
- previously patented drug products that have gone off-patent or left the Canadian market (“exiting drug effect”)
- patented drug products introduced to the Canadian market in 2014 (“new drug effect”)
- changes in prices among patented drug products with sales in Canada in both 2013 and 2014 (“price effect”)
- differences in the quantities of such drug products sold in the two years (“volume effect”)
- interactions of price and quantity changes (“cross effect”)
The first row of Table 8 gives these impacts as dollar amounts. The second row expresses the impacts as proportions of the overall change in sales between 2013 and 2014. For the sake of comparison, the third row provides average year-over-year proportionate impacts for 2010 through 2014.Footnote 3
The results in this table show that the increase in total sales that occurred between 2013 and 2014 was the result of two factors: increases in the quantity of existing drug products sold, and strong sales for new drugs, which offset a relatively large exiting drug effect.
Table 8. Decomposition of Changes in Sales of Patented Drug Products
|
Total Change |
Exiting Drug Effect |
New Drug Effect |
Price Effect |
Volume Effect |
Cross Effect |
Sales impact, 2014/2013
($millions) |
381.78 |
-344.14 |
351.61 |
-0.60 |
389.19 |
-14.32 |
Proportion of total change,
2014/2013 (%) |
100.00 |
-90.14 |
92.09 |
-0.15 |
101.94 |
-3.75 |
Average proportion of total change,
2010–2013 (%) |
100.00 |
-165.33 |
215.80 |
34.67 |
30.79 |
-15.93 |
Source: PMPRB
Figure 2 breaks down 2014 sales of patented drug products according to the year in which the product was first sold in Canada. Throughout the latter part of the 1990s and early 2000s, sales growth was largely driven by a succession of new “blockbuster” products that ultimately achieved very high sales volumes. Despite the recent patent expiries (“patent cliff”), these products still accounted for a considerable share of patented drug sales in 2014. Since mid-2000s, changes in the Canadian pharmaceutical environment, along with a reduction in the rate of introduction of new high-volume products, has resulted in dampened growth.
Figure 2. Share of 2014 (%) Sales of Patented Drug Products by Year of Introduction
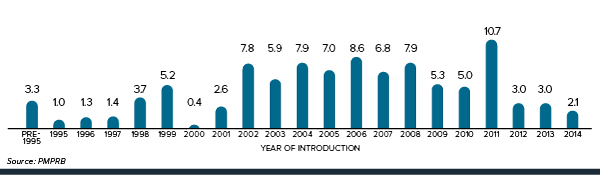
Figure description
This is a bar graph depicting the share of 2014 sales, in percent, of patented drug products by the year in which the product was first sold in Canada. Drugs introduced before 1995 comprised 3.3% of the share of sales in 2014. In 1995: 1.0; 1996: 1.3; 1997: 1.4; 1998: 3.7; 1999: 5.2; 2000: 0.4; 2001: 2.6; 2002: 7.8; 2003: 5.9; 2004: 7.9; 2005: 7.0; 2006: 8.6; 2007: 6.8; 2008: 7.9; 2009: 5.3; 2010: 5.0; 2011: 10.7; 2012: 3.0; 2013: 3.0; 2014: 2.1.
Sales by Therapeutic Class
The PMPRB classifies drug products according to the World Health Organization’s (WHO) Anatomical Therapeutic Chemical (ATC) system when it conducts analyses at the level of therapeutic class. This is a hierarchical system that classifies drug products according to their principal therapeutic use and chemical composition. At its first level of aggregation (Level 1), the ATC system classifies drug products according to the element of human anatomy with which they are primarily associated.
Table 9 breaks out sales of patented drug products in Canada in 2014 by major therapeutic class, defined by ATC Level 1. The table gives the 2014 sales for each class, the share of the total sales this represents and the rate at which sales grew relative to 2013. Values in the last column represent the component of overall sales growth attributable to drug products in the corresponding therapeutic class.Footnote 4 By this measure, antineoplastics and immunomodulating agents made the largest positive contribution to sales growth. Lower sales of both general antiinfectives for systemic use and antiparasitic products and nervous system drugs also had a significant impact on overall expenditure.
Table 9. Sales of Patented Drug Products by Major Therapeutic Class, 2014
| Therapeutic Class |
2014 Sales
($millions) |
Share: 2014 Sales (%) |
Growth: 2014/2013 ($millions) |
Growth: 2014/2013 (%) |
Impact on Change in Expenditure (%) |
| A: Alimentary tract and metabolism |
1,505.5 |
11.0 |
116.2 |
8.4 |
28.5 |
| B: Blood and blood forming organs |
784.9 |
5.7 |
4.2 |
0.5 |
1.0 |
| C: Cardiovascular system |
911.6 |
6.6 |
-37.1 |
-3.9 |
-9.1 |
| D: Dermatologicals |
109.7 |
0.8 |
-20.3 |
-15.6 |
-5.0 |
| G: Genito-urinary system and sex hormones |
506.1 |
3.7 |
-8.3 |
-1.6 |
-2.0 |
| H: Systemic hormonal preparations |
62.4 |
0.5 |
-0.8 |
-1.2 |
-0.2 |
J: General antiinfectives for systemic use; and
P: Antiparasitic products* |
1,256.8 |
9.1 |
-160.2 |
-11.3 |
-39.2 |
| L: Antineoplastics and immunomodulating agents |
4,225.8 |
30.8 |
290.6 |
7.4 |
71.2 |
| M: Musculo-skeletal system |
452.1 |
3.3 |
28.1 |
6.6 |
6.9 |
| N: Nervous system |
1,694.1 |
12.3 |
-141.7 |
-7.7 |
-34.7 |
| R: Respiratory system |
1,164.5 |
8.5 |
-10.1 |
-0.9 |
-2.5 |
| S: Sensory organs |
723.1 |
5.3 |
79.3 |
12.3 |
19.4 |
| V: Various |
343.3 |
2.5 |
268.2 |
357.1 |
65.7 |
| All therapeutic classes |
13,739.8 |
100.0† |
408.2 |
3.1 |
100.0† |
* These groups have been combined for reasons of confidentiality.
† Values in this column may not add to 100.0 due to rounding.
Source: PMPRB
Price Trends
The PMPRB uses the Patented Medicines Price Index (PMPI) to monitor trends in prices of patented drug products. The PMPI measures the average year-over-year change in the ex-factory prices of patented drug products sold in Canada. The index is constructed using a formula that takes a sales-weighted average of price changes observed at the level of individual drug products.Footnote 5 This is similar to the approach Statistics Canada uses to construct the Consumer Price Index (CPI). The PMPI is based on an average transaction price and sales information for a six-month period submitted by patentees.
It is important to understand the conceptual relationship between the PMPI and drug costs. The PMPI does not measure changes in the utilization of patented drug products; a quantity index, the , is calculated for this purpose (see Utilization of Patented Drug Products). The PMPI does not measure the cost impact of changes in prescribing patterns or the introduction of new medicines. By design, the PMPI isolates the component of sales growth attributable to changes in prices.
Figure 3 provides year-over-year changes in the PMPI for the years 1988 through 2014. As measured by the PMPI, prices of patented drug products were virtually unchanged from 2013 to 2014.
Figure 3. Annual Rates of Change (%), Patented Medicines Price Index (PMPI), 1988–2014
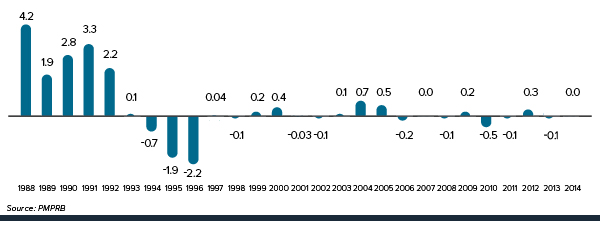
Figure description
This is a bar graph depicting the year-over-year changes, in percent, in the Patented Medicines Price Index (PMPI) for the years 1988 through 2014. In 1988, the rate of change in the PMPI was 4.2. 1989: 1.9; 1990: 2.8; 1991: 3.3; 1992: 2.2; 1993: 0.1; 1994: -0.7; 1995: -1.9; 1996: -2.2; 1997: 0.04; 1998: -0.1; 1999: 0.2; 2000: 0.4; 2001: -0.03; 2002: -0.1; 2003: 0.1; 2004: 0.7; 2005: 0.5; 2006: -0.2; 2007: 0.0; 2008: -0.1; 2009: 0.2; 2010: -0.5; 2011: -0.1; 2012: 0.3; 2013: -0.1; 2014: 0.0.
The Patent Act requires the PMPRB to consider changes in the CPI, among other factors, in determining whether the price of a patented drug product is excessive. Figure 4 plots year-over-year rates of change in the PMPI against corresponding changes in the CPI. General price inflation, as measured by the CPI, has exceeded the average increase in patented drug prices almost every year since 1988. In 2014, the CPI rose by 2.0%, while the PMPI was on average unchanged from 2013 to 2014 at 0.0%.
Figure 4. Annual Rate of Change, Patented Medicines Price Index (PMPI) and Consumer Price Index (CPI), 1988-2014
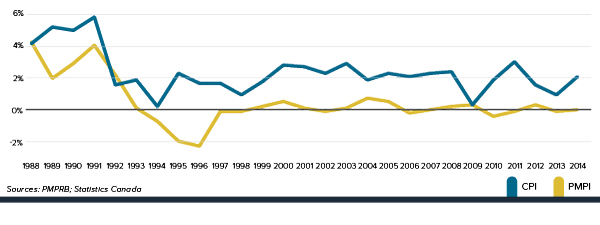
Figure description
This is a line graph depicting the year-over-year rates of change in the Patented Medicines Price Index (PMPI) against corresponding changes in the Consumer Price Index (CPI), in percent. In 1988, the rate of change in the PMPI was 0.041. The rate of change in the CPI was 0.04. 1989: PMPI 0.019, CPI 0.05; 1990: PMPI 0.028, CPI 0.048; 1991: PMPI 0.039, CPI 0.056; 1992: PMPI 0.021, CPI 0.015; 1993: PMPI 0.001, CPI 0.018; 1994: PMPI -0.007, CPI 0.002; 1995: PMPI -0.019, CPI 0.022; 1996: PMPI -0.022, CPI 0.015; 1997: PMPI -0.001, CPI 0.017; 1998: PMPI -0.001, CPI 0.009; 1999: PMPI 0.002, CPI 0.017; 2000: PMPI 0.005, CPI 0.027; 2001: PMPI 0.1, CPI, 2.6; 2002: PMPI -0.012, CPI 0.023; 2003: PMPI 0.001, CPI 0.028; 2004: PMPI 0.007, CPI 0.018; 2005: PMPI 0.005, CPI 0.022; 2006: PMPI -0.002, CPI 0.020; 2007: PMPI 0.000, CPI 0.022; 2008: PMPI 0.002, CPI 0.023; 2009: PMPI 0.003, CPI 0.003; 2010: PMPI -0.004, CPI 0.018; 2011: PMPI -0.001, CPI 0.029; 2012: PMPI 0.003, CPI 0.015; 2013: PMPI -0.001, CPI 0.009; 2014: PMPI 0.000, CPI 0.020.
It is not surprising that the PMPI has seldom kept pace with the CPI. The PMPRB's Guidelines allow the price of a patented drug product to rise by no more than the CPI over any three-year period. (The Guidelines also impose a cap on year-over-year price increases equal to one and one-half times the current year rate of CPI inflation.) This effectively establishes CPI inflation as an upper bound on the amount by which individual prices may rise over any three-year period.Footnote 6 Increases in the PMPI normally do not reach this upper bound because many patentees do not raise their prices by the full amount permitted under the Guidelines, or choose to reduce their prices.
Price Change by Therapeutic Class
Table 10 provides average rates of price change among patented drug products at the level of major therapeutic classes. Results in this table were obtained by applying the PMPI methodology to data segregated by their ATC Level 1 class. The last column provides a decomposition of overall PMPI change, with each entry representing the component of the overall change attributable to drug products in the corresponding therapeutic class. By this measure, the unchanged PMPI (0.0%) reflects a general state of price stability across therapeutic classes. Note that all of the therapeutic classes saw an average rate of price change below the rate of CPI inflation.Footnote 7
Table 10. Change in the Patented Medicines Price Index (PMPI), by Major Therapeutic Class, 2014
| Therapeutic Class |
Share: 2014 Sales (%) |
Price Change: 2013 to 2014 (%) |
Contribution: Change in PMPI (%) |
| A: Alimentary tract and metabolism |
11.0 |
-0.9 |
-0.1 |
| B: Blood and blood forming organs |
5.7 |
-1.9 |
-0.1 |
| C: Cardiovascular system |
6.6 |
0.1 |
0.0 |
| D: Dermatologicals |
0.8 |
-0.3 |
0.0 |
| G: Genito-urinary system and sex hormones |
3.7 |
1.1 |
0.0 |
| H: Systemic hormonal preparations |
0.5 |
0.6 |
0.0 |
J: General antiinfectives for systemic use; and
P: Antiparasitic products* |
9.1 |
1.0 |
0.1 |
| L: Antineoplastics and immunomodulating agents |
30.8 |
0.3 |
0.1 |
| M: Musculo-skeletal system |
3.3 |
0.6 |
0.0 |
| N: Nervous system |
12.3 |
-0.1 |
0.0 |
| R: Respiratory system |
8.5 |
0.0 |
0.0 |
| S: Sensory organs |
5.3 |
-0.2 |
0.0 |
| V: Various |
2.5 |
-3.1 |
-0.1 |
| All therapeutic classes |
100.0† |
0.0 |
0.0 |
* These groups have been combined for reasons of confidentiality.
† Values in this column may not add to 100.0 due to rounding.
Source: PMPRB
Price Change by Class of Customer
Figure 5 presents average rates of price change by class of customer.Footnote 8 These results were obtained by applying the PMPI methodology separately to sales data for hospital, pharmacy and wholesale customers.Footnote 9 The 2014 rates of price change for these classes were, respectively, -0.4%, -0.8% and 0.1%.
Figure 5. Annual Rate of Change (%), Patented Medicine Price Index (PMPI), by Class of Customer, 2011–2014
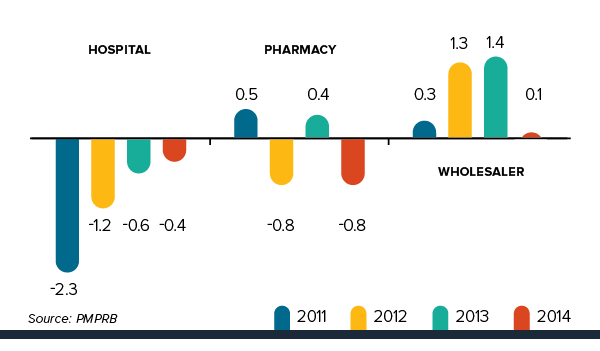
Figure description
This is a bar graph depicting average rates of price change by class of customer, in percent. In 2011, the average rate of price change for hospitals was -2.3. For pharmacies, it was 0.5. For wholesalers, it was 0.3. 2012: Hospital -1.2, Pharmacy -0.8, Wholesaler 1.3; 2013: Hospital -0.6, Pharmacy 0.4, Wholesaler 1.4; 2014: Hospital -0.4, Pharmacy -0.8, Wholesaler 0.1.
Price Change by Province/Territory
Figure 6 presents average annual rates of price change by province/territory, obtained by applying the PMPI methodology to sales data segregated by the province/territory in which the sale occurred. These results indicate that, between 2013 and 2014, prices of patented drug products in PEI fell on average. The largest average price increase occurred in Nova Scotia (0.4%).
Figure 6. Annual Rate of Price Change, by Province/Territory* and Class of Customer†, 2014
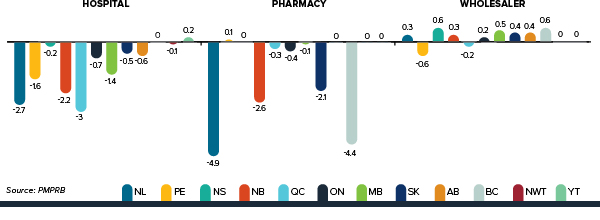
*Values for Nunavut are included in the Northwest Territories (NWT).
†Results for “All” in Figure 6 does not include the class of customer “other”.
Figure description
This is a bar graph depicting average annual rates of price change by province/territory and class of customer in between 2013 and 2014.
For hospitals:
- Newfoundland -2.7
- PEI -1.6
- Nova Scotia -0.2
- New Brunswick -2.2
- Quebec -3.0
- Ontario -0.7
- Manitoba -1.4
- Saskatchewan -0.5
- Alberta -0.6
- British Columbia 0.0
- Northwest Territories -0.1
- Yukon 0.2
For pharmacies:
- Newfoundland -4.9
- PEI 0.1
- Nova Scotia 0.0
- New Brunswick -2.6
- Quebec -0.3
- Ontario -0.4
- Manitoba -0.1
- Saskatchewan -2.1
- Alberta 0.0
- British Columbia -4.4
- Northwest Territories 0.0
- Yukon 0.0
For wholesalers:
- Newfoundland 0.3
- PEI -0.6
- Nova Scotia 0.6
- New Brunswick 0.3
- Quebec -0.2
- Ontario 0.2
- Manitoba 0.5
- Saskatchewan 0.4
- Alberta 0.4
- British Columbia 0.6
- Northwest Territories 0.0
- Yukon Territories 0.0.
Price Behaviour after Introduction
Does the price of a typical patented drug product change much in the years after it enters the Canadian market? To answer this question, Figure 7 provides the average ratio of the 2014 price to introductory price (the price at which the drug product was sold in its first year on the Canadian market).
Figure 7. Average Ratio of 2014 Price to Introductory Price, by Year of Introduction
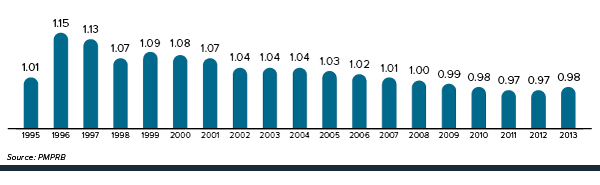
Figure description
This is a bar graph that depicts the average ratio of the 2014 price of a typical patented drug product to the introductory price (the price at which the drug product was sold in its first year on the Canadian market).
In 1995, the average ratio between the 2014 price to the introductory price is 1.01. In 1996, 1.15; 1997, 1.13; 1998, 1.07; 1999, 1.09; 2000, 1.08; 2001, 1.07; 2002, 1.04; 2003, 1.04; 2004, 1.04; 2005, 1.03; 2006, 1.02; 2007, 1.01; 2008, 1.00; 2009, 0.99; 2010, 0.98; 2011, 0.97; 2012, 0.97; 2013, 0.98.
The results in Figure 7 imply no consistent tendency for prices to either rise or fall substantially after introduction, with the average 2014 price of a typical patented drug product being within a few percentage points of its introductory price.Footnote 10 For example, the prices of products introduced a decade ago are only 4% higher in 2014.
Price Change by Country
In accordance with the Act and the Regulations, patentees must report publicly available prices of patented drug products for seven foreign comparator countries (“PMPRB7”): France, Germany, Italy, Sweden, Switzerland, the United Kingdom and the United States.
The PMPRB uses this information to:
- conduct international price comparison tests (as specified in its Guidelines)
- compare the Canadian prices of patented drug products to those prevailing in other countries
Figure 8 gives the average annual rates of price change for Canada and each of the seven comparator countries. These results were obtained by applying the PMPI methodology (with weights based on Canadian sales patterns) to the international price data that patentees have submitted to the PMPRB. Note that results for the United States are based on prices that incorporate prices from the US Federal Supply Schedule (FSS).Footnote 11
Figure 8. Annual Average Rates of Price Change, Canada and Comparator Countries, 2014
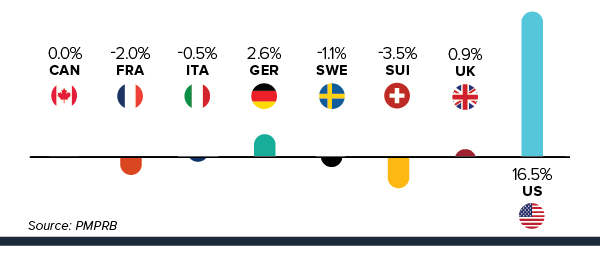
Figure description
This is a bar graph depicting the average annual rates of price change for Canada and each of the seven comparator countries, in percent. In Canada, the average annual rate of price change was 0.0. France, -2.0; Italy, -0.5; Germany, 2.6; Sweden, -1.1; Switzerland, -3.5; UK, 0.9; US, 16.5.
The results in Figure 8 indicate that in 2014, the United States saw prices rise at an average rate of 16.5%. The United Kingdom and Germany saw more modest average price increases, while prices in France, Italy, Switzerland and Sweden declined.
The foreign market results are based on publicly available ex-factory gate price information (generally for the retail customer class) submitted by patentees to the PMPRB. The Canadian rate of change, however, is based on the actual average transaction prices and is net of rebates and discounts provided by manufacturers to their direct customers.
Comparison of Canadian Prices to Foreign Prices
Tables 11 and 12 provide detailed statistics comparing the foreign prices of patented drug products to their Canadian prices. Each table provides two sets of average price ratios. These are differentiated according to the method by which foreign prices were converted to their Canadian dollar equivalents. The tables also give the numbers of drug products (DINs) and the volume of sales encompassed by each reported price ratio.Footnote 12
The average price ratios given in Tables 11 and 12 are sales-weighted arithmetic means of price ratios obtained for individual drug products, with weights based on Canadian sales patterns. Average price ratios constructed in this way provide exact answers to questions of the following type:
How much more/less would Canadians have paid for the patented drug products they purchased in 2014 had they paid Country X prices rather than Canadian prices?
For example, Table 11 states that the 2014 average French-to-Canadian price ratio was 0.75. This means Canadians would have paid 25% less for the patented drug products they purchased in 2014 had they bought these products at French prices.
For many years, the PMPRB has reported average foreign-to-Canadian price ratios with foreign prices converted to their Canadian dollar equivalents by means of market exchange rates. (More exactly, the 36-month moving averages of market rates the PMPRB normally uses in applying its Guidelines.) Table 11 also reports foreign-to-Canadian price ratios with currency conversion at purchasing power parity (PPP). The PPP between any two countries measures their relative costs of living expressed in units of their own currencies. In practice, cost of living is determined by pricing out a standard “basket” of goods and services at the prices prevailing in each country.
Because PPPs are designed to represent relative costs of living, they offer a simple way to account for differences in overall national price levels when comparing individual prices, incomes and other monetary values across countries. When applied to the calculation of average foreign-to-Canadian price ratios they produce statistics answering questions of this type:
How much more/less consumption of other goods and services would Canadians have sacrificed for the patented drug products they purchased in 2014 had they lived in Country X?
Questions of this type cannot be answered by simply comparing drug prices. Rather, one must first calculate what each price represents in terms of goods and services foregone. PPPs are designed for such purposes.
Bilateral Comparisons
Table 11 provides bilateral comparisons of prices in each of the PMPRB’s seven comparator countries to corresponding Canadian prices. Focusing on the results with currency conversion at market exchange rates, it appears that, as in previous years, Canadian prices were typically within the range of prices observed among the comparator countries. Prices in France, Italy, United Kingdom, Sweden and Switzerland were appreciably lower than Canadian prices, while those in Germany were higher. As in previous years, prices reported for the United States were much higher than prices in Canada or any other comparator country.
Table 11. Average Foreign-to-Canadian Price Ratios, Bilateral Comparisons, 2014
At Market Exchange Rates
|
Canada |
France |
Italy |
Germany |
Sweden |
Switzerland |
United Kingdom |
United States |
| Average price ratio 2014 |
1.00 |
0.75 |
0.87 |
1.14 |
0.96 |
0.97 |
0.86 |
2.47 |
| Average price ratio 2013 |
1.00 |
0.72 |
0.79 |
1.04 |
0.90 |
0.95 |
0.77 |
2.07 |
At Purchasing Power Parities
|
Canada |
France |
Italy |
Germany |
Sweden |
Switzerland |
United Kingdom |
United States |
| Average price ratio 2014 |
1.00 |
0.82 |
1.05 |
1.32 |
0.88 |
0.80 |
0.93 |
2.97 |
| Average price ratio 2013 |
1.00 |
0.78 |
0.97 |
1.23 |
0.85 |
0.78 |
0.86 |
2.53 |
| Number of patented drug products 2014 |
1,345 |
772 |
849 |
974 |
940 |
900 |
946 |
1,100 |
| Sales ($millions) |
13,739.82 |
10,009.96 |
10,949.53 |
11,992.04 |
11,606.85 |
11,500.61 |
11,637.63 |
12,763.82 |
Source: PMPRB
It is important to note that it is not always possible to find a matching foreign price for each and every patented drug product sold in Canada. Table 11 displays how often an international price comparison was available for each of the comparator countries. For example, out of 1,345 patented drug products under the PMPRB's jurisdiction in 2014, a publicly available ex-factory gate price for France was available only 58% of the time, whereas for the US the number was 82%, by far the highest. Given the integrated nature of the Canadian and US supply chain, it is not uncommon for the US to be the only other country for which a comparator price to a product sold in Canada is available, in which case it is deemed to constitute the international median price as per the PMPRB's methodology.
Average price ratios obtained with currency conversion at PPPs tell the same story. When international differences in cost of living are accounted for, it appears Canadians incurred a larger consumption cost for the patented drug products they purchased in 2014 than did residents of every other comparator country except Italy, Germany and the United States.
Figure 9 puts these results in historical perspective. In 2005, Canadian prices were, on average, approximately equal to or below corresponding prices in all comparators other than Italy. By 2014, Canadian prices were decidedly above prices in the United Kingdom, France and Italy, and somewhat higher than prices in Sweden and Switzerland.
Figure 9. Average Foreign-to-Canadian Price Ratios: 2005, 2014
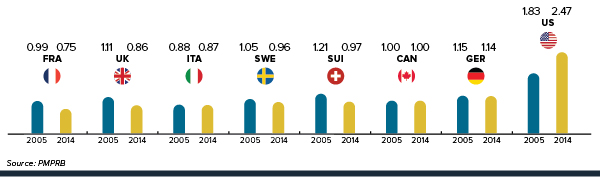
Figure description
This is a bar graph depicting the average foreign-to-Canadian price ratios in 2005 and 2014.
- France — 2005: 0.99, 2014: 0.75
- United Kingdom — 2005: 1.11, 2014: 0.86
- Italy — 2005: 0.88, 2014: 0.87
- Sweden — 2005: 1.05, 2014: 0.96
- Switzerland — 2005: 1.21, 2014: 0.97
- Canada — 2005: 1.00, 2014: 1.00
- Germany — 2005: 1.15, 2014: 1.14
- United States — 2005: 1.83, 2014: 2.47
If the patented medicine is being sold in one or more of the comparator countries (PMPRB7), the patentee must report the publicly available ex-factory prices to the PMPRB for each class of customer.Footnote 13 In order to assess how Canada compares to a basket of countries beyond the PMPRB7, Figure 10 uses Canadian and international prices reported in the IMS AG MIDAS™ database at the ex-factory manufacturer level, reflecting all sales to the pharmacy and hospital sectors.
The international price comparisons reported in Figure 10 provide a bilateral price comparison using all countries in the Organisation for Economic Co-operation and Development (OECD) available in MIDAS™. The average foreign-to-Canadian price ratios are constructed using exactly the same approach employed to produce the ratios presented in Figure 9. These are Canadian sales-weighted arithmetic averages of the corresponding foreign-to-Canadian price ratios for individual drugs.Footnote 14 As shown below, Canadian prices are on average approximately 26% above the median of the OECD and are fourth highest among the 31 countries.
Figure 10. Average Foreign-to-Canadian Price Ratios, Patented Drugs, OECD, 2014
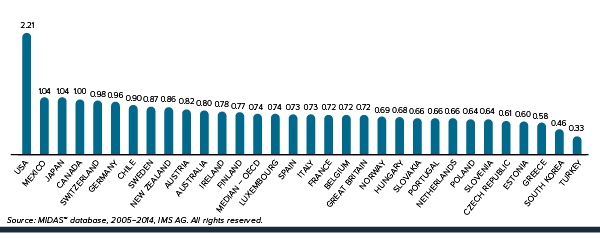
Figure description
This is a bar graph depicting the average foreign-to-Canadian price ratios of patented drugs in 2014 for OECD countries, using Canadian and international prices reported in the IMS AG MIDAS™ database. United States: 2.21; Mexico: 1.04; Japan: 1.04; Canada: 1.00; Switzerland: 0.98; Germany: 0.96; Chile: 0.90; Sweden: 0.87; New Zealand: 0.86; Austria: 0.82; Australia: 0.80; Ireland: 0.78; Finland: 0.77; median for the OECD: 0.74; Luxembourg: 0.74; Spain: 0.73; Italy: 0.73, France: 0.72; Belgium: 0.72; Great Britain: 0.72; Norway: 0.69; Hungary: 0.68; Slovakia: 0.66; Portugal: 0.66; Netherlands: 0.66; Poland: 0.64; Slovenia: 0.64; Czech Republic: 0.61; Estonia: 0.60; Greece: 0.58; South Korea: 0.46; Turkey: 0.33.
Multilateral Price Comparisons
Table 12 provides average foreign-to-Canadian price ratios using several multilateral measures of foreign prices. The median international price (MIP) is the median of prices observed among the seven comparator countries. Other multilateral price ratios compare the minimum, maximum and simple mean of foreign prices to their Canadian counterparts.
Table 12. Average Foreign-to-Canadian Price Ratios, Multilateral Comparisons, 2014
|
Median |
Minimum |
Maximum |
Mean |
| Average price ratio at market exchange rates |
1.13 |
0.82 |
2.48 |
1.31 |
| Average price ratio at purchasing power parities |
1.19 |
0.93 |
2.95 |
1.45 |
| Number of patented drug products |
1,262 |
1,262 |
1,262 |
1,262 |
| Sales ($millions) |
13,448.29 |
13,448.29 |
13,448.29 |
13,448.29 |
Source: PMPRB
Focusing again on results at market exchange rates, the average MIP-to-Canadian price ratio stood at 1.13 in 2014. (The corresponding value for 2013 was 1.06.) Note that mean foreign prices produce higher foreign-to-Canadian price ratios than do MIPs. This is explained by the influence of US prices, which are typically much higher than prices elsewhere. Although US prices nearly always figure importantly in determining mean foreign price, this is less so when it comes to median international prices. Nevertheless, the US does exercise a significant influence over the average ratio of median international prices relative to Canadian prices because of the not infrequent phenomenon mentioned in the previous section, whereby the US is the only country for which an ex-factory gate price for a patented drug product sold in Canada is available.
Figure 11 puts these results in historical perspective, giving a history of the average MIP-to-Canadian price ratios from 2001 to 2014. Although there has been considerable movement in the ratio over this period, it has remained above parity.
Figure 11. Average Ratio of Median International Price (MIP) to Canadian ATP Price, at Market Exchange Rates, 2001–2014
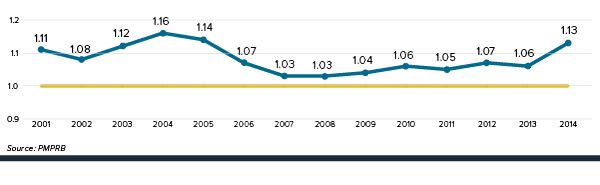
Figure description
This is a line graph depicting the history of the average MIP-to-Canadian price ratios from 2001 to 2014. In 2001, the average ratio of Median International Price (MIP) to Canadian average translation price, at market exchange rates, was 1.11. In 2002: 1.08; 2003: 1.12; 2004: 1.16; 2005: 1.14; 2006: 1.07; 2007: 1.03; 2008: 1.03; 2009: 1.04; 2010: 1.06; 2011: 1.05; 2012: 1.07; 2013: 1.06; 2014: 1.13.
Figure 12 provides alternate results for the average MIP-to-Canadian price ratio at market exchange rates in 2014. To address the previously-raised point that Canadian prices are national average transaction prices whereas foreign prices are list prices, a list price to list price ratio is calculated. Using this method, the average ratio decreases from 1.13 to 1.02. It is important to keep in mind that non-transparent rebates provided directly to payers are currently not captured in this data.
To account for the large impact of US prices in determining the mean foreign price, a ratio excluding the US and a ratio including at least five countries in the calculation of the median are also provided in Figure 12. With these restrictions, the average MIP-to-Canadian price ratio drops to 0.85 and 0.86, respectively, suggesting that Canadian list prices are on average 14%-15% higher than median foreign list prices. In many of the comparator countries, discounts off list prices are available to all payers, both public and private. By contrast, a large portion of the Canadian market (over 60%) is in fact paying list prices.
Figure 12. Average Ratio of Median International Price (MIP) to Canadian Price, at Market Exchange Rates, 2014
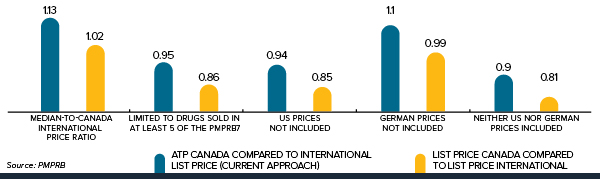
Figure description
This is a bar graph depicting the average ratio of Median International Price (MIP) to Canadian price at market exchange rates, using data from 2014.
|
Canada at N-ATP |
Canada at List Price |
| International median for PMPRB7 |
1.13 |
1.02 |
| Without Germany |
1.10 |
0.99 |
| Without US |
0.94 |
0.85 |
| Without Germany and US |
0.90 |
0.81 |
| Median limited to drugs sold in at least 5 of the PMPRB7 |
0.95 |
0.86 |
Figure 13 offers more detail on the product-level MIP-to-Canadian ratios underlying the averages reported in Table 12. This figure distributes the 2014 sales of each patented drug product according to the value of its MIP-to-Canadian price ratio (more exactly, according to the range into which the ratio fell).Footnote 15 These results show substantial dispersion in product-level price ratios: while patented drug products with MIP-to-Canadian price ratios between 0.90 and 1.10 accounted for 25.9% of sales, those with ratios less than 0.90 accounted for 45.6% of sales, and products with ratios exceeding 1.10 accounted for 28.5%.
Figure 13. Range Distribution, Sales, by MIP-to-Canadian Price Ratio, 2014
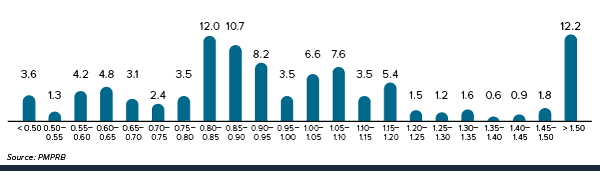
Figure description
This is a bar graph depicting the distribution of 2014 sales of each patented drug product according to the value of its MIP-to-Canadian price ratio (more exactly, according to the range into which the ratio fell).
‹ 0.50: 3.6; 0.50 to 0.55: 1.3; 0.55 to 0.60: 4.2; 0.60 to 0.65: 4.8; 0.65 to 0.70: 3.1; 0.70 to 0.75: 2.4; 0.75 to 0.80: 3.5; 0.80 to 0.85: 12.0; 0.85 to 0.90: 10.7; 0.90 to 0.95: 8.2; 0.95 to 1.00: 3.5; 1.00 to 1.05: 6.6; 1.05 to 1.10: 7.6; 1.10 to 1.15: 3.5; 1.15 to 1.20: 5.4; 1.20 to 1.25: 1.5; 1.25 to 1.30: 1.2; 1.30 to 1.35: 1.6; 1.35 to 1.40: 0.6; 1.40 to 1.45: 0.9; 1.45 to 1.50: 1.8; › 1.50: 12.2.
Utilization of Patented Drug Products
The price and sales data used to calculate the PMPI also allow the PMPRB to examine trends in the quantities of patented drug products sold in Canada. The PMPRB maintains the Patented Medicines Quantity Index (PMQI) for this purpose. Figure 14 provides average rates of utilization growth, as measured by the , from 1988 through 2014. These results confirm that in recent years, growth in the utilization of patented drug products has been the primary source of rising sales, with rates of utilization growth roughly tracking sales growth. This tracking pattern continued in 2014, with the utilization of patented drug products, on average, increasing by 3.6% between 2013 and 2014 and sales increasing by 3.1%.
Figure 14. Annual Rate of Change (%), Patented Medicines Quantity Index (PMQI), 1988-2014
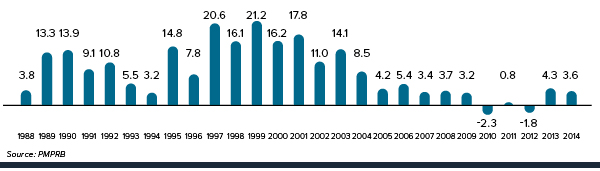
Figure description
This is a bar graph depicting average rates of utilization growth, as measured by the Patented Medicines Quantity Index (PMQI), from 1988 through 2014, in percent.
1988: 3.8; 1989: 13.3; 1990: 13.9; 1991: 9.1; 1992: 10.8; 1993: 5.5; 1994: 3.2; 1995: 14.8; 1996: 7.8; 1997: 20.6; 1998: 16.1; 1999: 21.2; 2000: 16.2; 2001: 17.8; 2002: 11.0; 2003: 14.1; 2004: 8.5; 2005: 4.2; 2006: 5.4; 2007: 3.4; 2008: 3.7; 2009: 3.2; 2010: -2.3; 2011: 0.8; 2012: -1.8; 2013: 4.3; 2014 : 3.6.
Utilization Growth by Therapeutic Class
Table 13 provides average rates of utilization growth among patented drug products at the level of major therapeutic classes. The results in this table were obtained by applying the methodology to data segregated by ATC Level I class. As in Table 13, the last column provides an approximate decomposition of overall PMQI change into contributions attributable to each therapeutic class.
In 2014, levels of utilization increased in eight therapeutic classes. Modest growth in antineoplastics and immunomodulating agents, alimentary tract and metabolism and sensory organ products accounted for most of the growth in overall utilization. Utilization of drug products in the nervous system, blood and blood forming organs and cardiovascular system declined.
Table 13. Change in the Patented Medicines Quantity Index (PMQI), by Major Therapeutic Class, 2014
| Therapeutic Class |
Share: 2014 Sales (%) |
Quantity Change: 2013 to 2014 (%) |
Contribution: Change in (%) |
| A: Alimentary tract and metabolism |
11.0 |
10.2 |
1.1 |
| B: Blood and blood forming organs |
5.7 |
-5.6 |
-0.3 |
| C: Cardiovascular system |
6.6 |
-4.2 |
-0.3 |
| D: Dermatologicals |
0.8 |
-4.8 |
0.0 |
| G: Genito-urinary system and sex hormones |
3.7 |
-0.6 |
0.0 |
| H: Systemic hormonal preparations |
0.5 |
2.1 |
0.0 |
J: General antiinfectives for systemic use; and
P: Antiparasitic products* |
9.1 |
-1.9 |
-0.2 |
| L: Antineoplastics and immunomodulating agents |
30.8 |
8.7 |
2.7 |
| M: Musculo-skeletal system |
3.3 |
5.8 |
0.2 |
| N: Nervous system |
12.3 |
-6.1 |
-0.8 |
| R: Respiratory system |
8.5 |
0.7 |
0.1 |
| S: Sensory organs |
5.3 |
12.6 |
0.7 |
| V: Various |
2.5 |
7.8 |
0.2 |
| All therapeutic classes |
100.0† |
3.6 |
3.6 |
* These groups have been combined for reasons of confidentiality.
† Values in this column may not add to 100.0 due to rounding.
Source: PMPRB
Canadian Drug Expenditures in the Global Context
IMS HealthFootnote 16 regularly reports on drug sales across a large number of countries. Based on sales data from this source, Figure 15 provides shares of global sales for Canada and each of the seven comparator countries that the PMPRB considers in conducting its price reviews (PMPRB7).Footnote 17 The Canadian market accounted for 2.2% of the global market in 2014.
Figure 15. Distribution of Drug Sales Among Major National Markets, 2014
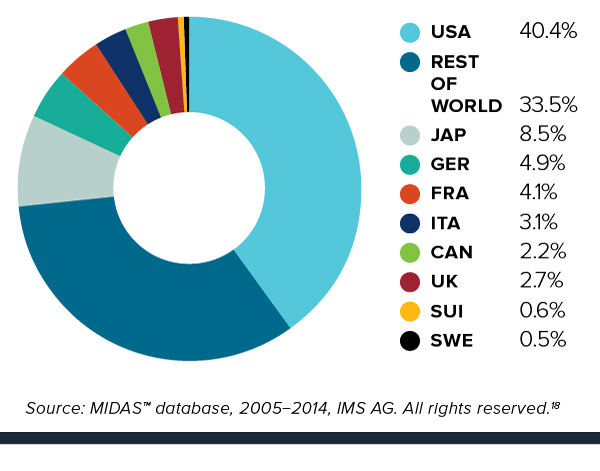
Figure description
This is a pie chart depicting the distribution of drug sales amont major global markets in 2014.
The United States market accounted for 40.4% of the global market in 2014. Japan: 8.5%; Germany: 4.9%; France: 4.1%; Italy: 3.1%; Canada: 2.2%; U.K.: 2.7%; Switzerland: 0.6%; Sweden: 0.5%; the rest of the world: 33.5%.
Figure 16 provides Canada’s share of global sales for 2005 to 2014. The Canadian share has remained between 2.2% and 2.7% throughout this period.
Figure 16. Canada’s Share of Drug Sales, 2005–2014
Figure description
This is a bar graph depicting Canada’s share of global sales for 2005 to 2014, in percent.
2005: 2.4; 2006: 2.6; 2007: 2.6; 2008: 2.6; 2009: 2.5; 2010: 2.7; 2011: 2.6; 2012: 2.6; 2013: 2.5; 2014: 2.2.
Figure 17 gives the average annual rate of growth in total drug sales for Canada and the seven comparator countries, individually and collectively (PMPRB7). From 2005 to 2014, drug sales in Canada rose at an average annual rate of approximately 3.9%. This is less than the average rate of growth in drug sales among the seven comparator countries over the same period.
Figure 17. Average Rate of Growth (%), Drug Sales, at Constant 2014 Market Exchange Rates, by Country, 2005–2014
Figure description
This is a bar graph depicting the annual rate of growth in total drug sales, in percent, for Canada and the seven comparator countries, individually and collectively (PMPRB7), between 2005 and 2014.
France: 1.9; Switzerland: 3.3; Sweden: 3.6; Canada: 3.9; Italy: 4.1; Germany: 4.3; PMPRB7: 5.3; UK: 5.7; US: 6.0.
Figure 18 compares rates of year-over-year growth in drug sales in Canada and the comparator countries combined (PMPRB7). In 2014, for the fifth consecutive year, sales grew at a slower rate in Canada than in the comparator countries.
Figure 18. Average Annual Rate of Change in Drug Sales, at Constant 2014 Market Exchange Rates, Canada and Comparator Countries, 2006–2014
Figure description
Figure 18 is a line graph comparing the average annual rate of change in drug sales, at constant 2014 market exchange rates, between Canada and comparator countries combined (PMPRB7), between 2006 and 2014.
2006: Canada 8.0, Comparators 7.1; 2007: Canada 6.9, Comparators 4.6; 2008: Canada 8.6, Comparators 2.4; 2009: Canada 6.6, Comparators 4.8; 2010: Canada 2.0, Comparators 2.8; 2011: Canada -1.0, Comparators 3.0; 2012: Canada -1.8, Comparators -0.9; 2013: Canada 1.6, Comparators 6.7; 2014: Canada 4.7, Comparators 18.8.
The proportion of national income allocated to the purchase of drug products provides another way to compare drug costs across countries.Footnote 19 Figure 19 gives drug expenditures as a share of Gross Domestic Product (GDP) for Canada and the seven comparator countries based on data for 2012. Drug expenditures absorbed between 1.0% and 2.0% of the GDP in the seven comparators. The Canadian value (2.0%) rivals the US at the top of this range.
Figure 19. Drug Expenditures as a Share of GDP, 2012
Figure description
This is a bar graph depicting drug expenditures as a share of Gross Domestic Product (GDP), in percent, for Canada and the seven comparator countries based on data for 2012.
Switzerland: 1.0; United Kingdom: 1.1; Sweden: 1.2; Italy: 1.6; Germany: 1.6; France: 1.8; Canada: 2.0; United States: 2.0.
Table 14 provides a historical perspective on the expenditures-to-GDP ratio. Between 2000 and 2012, drug expenditures in Canada grew at a faster rate than in the United States, at close to twice the rate of GDP growth.
Table 15 gives the composition of patentees’ sales by therapeutic class for Canada and the seven comparator countries, individually and as an aggregate (PMPRB7).Footnote 20 The results imply a remarkable degree of similarity across countries.
Table 14. Drug Expenditures as a Share of GDP, 2012Footnote 21
|
Share: Drug Expenditures/GDP 2012
(%) |
Share: Drug Expenditures/GDP 2000
(%) |
Growth: Drug Expenditures 2000-2012
(%) |
Growth: GDP 2000-2012
(%) |
| Canada |
1.96 |
1.42 |
184.43 |
105.86 |
| France |
1.83 |
1.81 |
89.61 |
87.25 |
| Germany |
1.63 |
1.43 |
112.95 |
87.14 |
| Italy |
1.55 |
1.74 |
75.84 |
96.78 |
| Sweden |
1.18 |
1.18 |
74.27 |
74.15 |
| Switzerland |
1.05 |
1.11 |
75.94 |
86.21 |
| United Kingdom |
1.14 |
1.14 |
66.18 |
65.61 |
| United States |
2.03 |
1.46 |
129.98 |
65.57 |
Source: OECD
Table 15. Distribution of Drug Sales (%) by Major Therapeutic Class for Canada and Comparator Countries, 2014
| Therapeutic Class |
Canada |
PMPRB7 |
France |
Italy |
Germany |
Sweden |
Switzerland |
United Kingdom |
United States |
| A: Alimentary tract and metabolism |
12.4 |
12.9 |
10.0 |
11.3 |
11.0 |
9.0 |
11.3 |
10.8 |
13.7 |
| B: Blood and blood forming organs |
4.3 |
5.1 |
7.4 |
8.5 |
6.5 |
7.4 |
5.6 |
4.7 |
4.4 |
| C: Cardiovascular system |
10.8 |
8.6 |
10.6 |
12.0 |
7.9 |
4.8 |
10.4 |
7.1 |
8.3 |
| D: Dermatologicals |
3.2 |
2.9 |
2.4 |
2.2 |
2.7 |
2.5 |
3.7 |
3.0 |
3.1 |
| G: Genito-urinary system and sex hormones |
5.2 |
4.7 |
3.1 |
3.9 |
3.3 |
4.2 |
4.6 |
3.9 |
5.1 |
| H: Systemic hormonal preparations |
1.2 |
2.2 |
2.1 |
2.0 |
2.0 |
2.3 |
1.6 |
2.7 |
2.2 |
| J: General antiinfectives for systemic use |
8.0 |
12.4 |
13.9 |
12.8 |
10.8 |
10.6 |
10.9 |
10.5 |
12.5 |
| L: Antineoplastics and immunomodulating agents |
18.3 |
18.3 |
18.9 |
18.2 |
22.7 |
25.5 |
19.5 |
19.3 |
17.5 |
| M: Musculo-skeletal system |
3.6 |
3.2 |
3.3 |
3.7 |
3.7 |
3.1 |
5.3 |
2.5 |
3.1 |
| N: Nervous system |
17.6 |
16.4 |
13.8 |
11.6 |
14.3 |
16.5 |
15.3 |
18.0 |
17.2 |
| P: Antiparasitic products |
0.2 |
0.2 |
0.2 |
0.0 |
0.1 |
0.2 |
0.2 |
0.2 |
0.2 |
| R: Respiratory system |
7.3 |
6.9 |
5.9 |
5.7 |
6.5 |
8.1 |
6.1 |
9.2 |
7.0 |
| S: Sensory organs |
4.0 |
2.7 |
3.2 |
2.2 |
2.8 |
2.7 |
3.9 |
4.1 |
2.5 |
| V: Various |
3.9 |
3.5 |
5.2 |
6.1 |
5.6 |
3.0 |
1.6 |
3.9 |
2.9 |
| All therapeutic classes |
100.0 |
100.0 |
100.0 |
100.0 |
100.0 |
100.0 |
100.0 |
100.0 |
100.0 |
* Values may not add to 100.0 due to rounding.
Source: MIDAS™, 2005–2014, IMS AG. All rights reserved.Footnote 18
The National Prescription Drug Utilization Information System: Supporting Health-Care Decision Making in Canada
How medications are used — where, by whom and for what — has an impact on the amount that Canadians spend on drugs. The PMPRB contributes to Canada’s understanding of these trends through the National Prescription Drug Utilization Information System (NPDUIS) initiative, generating comprehensive, accurate information to help guide decision making and support continued sustainability of our pharmaceutical system.
The PMPRB Works Collaboratively with the Provinces and Territories
PMPRB reporting has been relied on by the Council of the Federation as part of the pan-Canadian Pharmaceutical Alliance’s efforts to reduce brand-name and generic prices.
NPDUIS Publications
PMPRB NPDUIS Publications Inform Canadians
NPDUIS provides objective, timely information on a wide variety of topics including generic drug use and cost, new pipeline drugs, opioid use, and key cost drivers in drug plans.
Background
The National Prescription Drug Utilization Information System (NPDUIS) is a research initiative established by federal, provincial, and territorial Ministers of Health in September 2001. It is a partnership between the PMPRB and the Canadian Institute for Health Information (CIHI).
Its purpose is to provide policy makers and public drug plan managers with critical analyses of price, utilization and cost trends, so that Canada's health care system has more comprehensive and accurate information on how prescription drugs are being used and on sources of cost increases.
The NPDUIS Advisory Committee, composed of representatives from public drug plans in British Columbia, Alberta, Saskatchewan, Manitoba, Ontario, New Brunswick, Nova Scotia, Prince Edward Island, Newfoundland and Labrador, Yukon, and Health Canada, advises the PMPRB on its research agenda and on individual studies. The Committee also includes observers from CIHI and the Canadian Agency for Drugs and Technologies in Health (CADTH).
Highlights
Through the NPDUIS research initiative, the PMPRB released four analytical studies in 2014/15:
- CompassRx: Annual Public Drug Plan Expenditure Report, 1st Edition
- Generic Drugs in Canada, 2013
- New Drug Pipeline Monitor, 6th Edition
- Utilization of Prescription Opioids in Canada's Public Drug Plans, 2006/07 to 2012/13
Synopses of the two most recent reports are provided below.
CompassRx: Annual Public Drug Plan Expenditure Report, 1st Edition
CompassRx is a flagship annual report and the first of its kind to identify the major factors driving prescription drug expenditures in public drug plans in Canada— an important element in allowing policy makers and researchers to understand current trends and anticipate future cost pressures and expenditure levels. This report is an essential tool for anyone interested in an in depth analysis of drug expenditures. The first edition covers public drug plan expenditures in 2012/13.
Key Findings
- In 2012/13, prescription drug expenditures in the select public drug plans totaled $7.7 billion. This was composed of drug costs (74.4%), pharmacy dispensing costs (21.4%) and pharmacy markups (4.2%).
Prescription Drug Expenditure for select public drug plans (2012/13): $7.7 billion
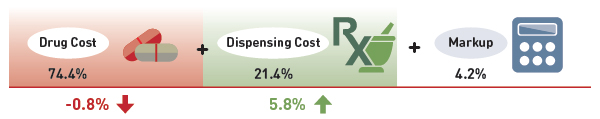
Data source: National Prescription Drug Utilization Information System Database, Canadian Institute for Health Information.
Results presented for a select number of public drug plans with available data: Alberta, Saskatchewan, Manitoba, Ontario, New Brunswick, Nova Scotia, Prince Edward Island and Health Canada’s Non-Insured Health Benefits drug plan.
Figure description
This image breaks down the $7.7 billion in prescription drug expenditures for the select public drug plans in 2012/13 into its component parts. Drug costs represented 74.4% of the total expenditures, a decrease of 0.8% from the previous year. Dispensing costs represented 21.4% of the total expenditures, an increase of 5.8% from the previous year. Markups represented 4.2% of the total expenditures for 2012/13.
- The select public drug plans paid 82.0% of the overall prescription drug expenditure level, with the remaining share being paid by the drug plan beneficiaries either out-of-pocket or through a third-party private insurer.
- The rates of change in the drug cost component of prescription drug expenditures in public drug plans have been steadily declining in recent years, with overall cost levels decreasing in 2012/13 by 0.8% compared to 2011/12.
- The low net rate of change was driven by opposing “push” (increasing) effects and “pull” (decreasing) effects which nearly off-set each other.
- The demographic, volume and drug-mix effects had an important “push” effect, and in the absence of generic savings, they would have increased drug cost levels by 8.5% in 2012/13.
- The generic price change and substitution effects had an important “pull” effect, and in the absence of other cost pressures, they would have decreased drug cost levels by 9.2% in 2012/13.
Drug Cost Drivers 2012/13
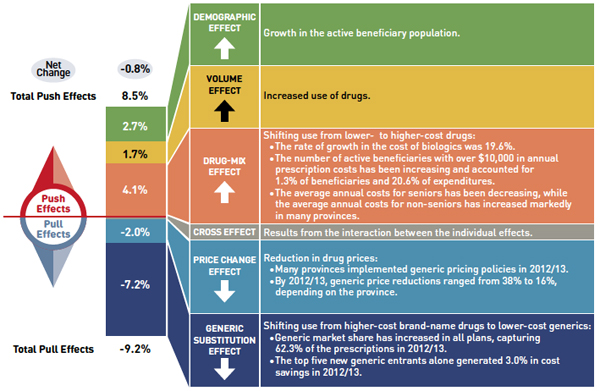
Note: Values may not add to totals due to rounding and the cross effect.
Data source: National Prescription Drug Utilization Information System Database, Canadian Institute for Health Information.
Results presented for a select number of public drug plans with available data: Alberta, Saskatchewan, Manitoba, Ontario, New Brunswick, Nova Scotia, Prince Edward Island and Health Canada’s Non-Insured Health Benefits drug plan.
Figure description
This diagram illustrates drug cost drivers for 2012/13, breaking them out into push (increasing) and pull (decreasing) effects. It shows the totals for the select public drug plans in Canada.
The overall net change in drug costs from 2011/12 to 2012/13 was -0.8%.
The total push effect was 8.5% and included the following key effects:
- The drug-mix effect (4.1%) due to shifting use from lower- to higher-cost drugs:
- The rate of growth in the cost of biologics was 19.6%.
- The number of active beneficiaries with over $10,000 in annual prescription costs has been increasing and accounted for 1.3% of beneficiaries and 20.6% of expenditures.
- The average annual costs for seniors have been decreasing, while the average annual costs for non-seniors have increased markedly in many provinces.
- The volume effect (1.7%) due to the increased use of drugs.
- The demographic effect (2.7%) due to the growth in the active beneficiary population.
The total pull effect was -9.2% and included the following key effects:
- The generic substitution effect (-7.2%) due to shifting use from higher-cost brand-name drugs to lower-cost generics:
- Generic market share has increased in all plans, capturing 62.3% of the prescriptions in 2012/13.
- The top five new generic entrants alone generated 3.0% in cost savings in 2012/13.
- The price change effect (-2.0%) due to a reduction in drug prices:
- Many provinces implemented generic pricing policies in 2012/13.
- By 2012/13, generic price reductions ranged from 38% to 16%, depending on the province.
A cross effect resulted from the interaction between the individual effects. No value is given for the cross effect.
Generic Drugs in Canada, 2013
Generic Drugs in Canada, 2013 is one of several reports the PMPRB has produced in recent years, comparing the price of generic drugs in Canada with those in other industrialized countries. It reports on the 2013 generic drug prices and highlights the changes in Canadian generic pricing that have taken place since 2011. The price of generic drugs in Canada is a critical issue for drug plan managers, policy makers and consumers.
Key Findings
- Canadian manufacturer prices for generic drugs have fallen markedly relative to their branded counterparts in recent years, with reductions in the relative price levels ranging from 56% of the brand price in the first quarter of 2011 to 31% in the second quarter of 2013, based on Ontario data.
- Despite a significant reduction in Canadian generic drug prices in recent years, they remain appreciably higher than international levels. In 2011, international generic prices were, on average, 35% lower than Canadian prices; by 2013, they were still 32% lower.
- The results based on prices available to the Ontario Drug Benefit Program in the second quarter of 2013, which are presumed to be more reflective of price reductions resulting from the early phase of the Value Price Initiative, reduce the price gap and are a marked improvement.
- The gap between foreign and Canadian generic prices was the widest (38%–39%) for drugs with a greater number of suppliers competing in the Canadian marketplace (six or more suppliers) and for drugs with greater sales ($10 million or more).
Average generic price relative to the brand level, Canada
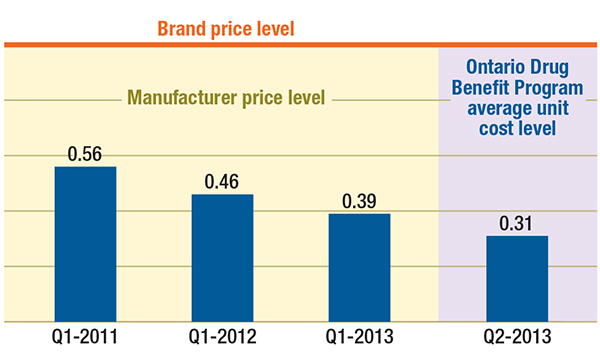
Figure description
This bar graph compares average generic drug prices in Canada and Ontario to brand-name prices. For Canada: Q1-2011 generics were 0.56 of brand prices; Q1-2012 0.46; Q1-2013 0.39. Ontario: Q2-2013 0.31.
Average generic foreign* price relative to the Ontario level, Q2-2013
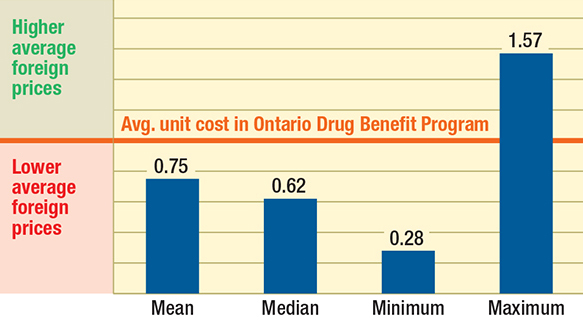
*France, Germany, Italy, Sweden, Switzerland, the United Kingdom and the United States
Source: MIDAS™, January–March 2011 and January–March 2013, IMS AG All Rights Reserved.
Ontario Drug Benefit Program, National Prescription Drug Utilization Information System Database, Canadian Institute for Health Information, April–June 2013
Figure description
This bar graph compares average international generic price levels to Ontario levels for Q2-2013. International prices: mean is 0.75; median is 0.62; minimum is 0.28; maximum is 1.57.
Research Agenda
The NPDUIS research agenda for the two upcoming fiscal years includes the following analytical studies:
- Private Drug Plans in Canada: Generic Drug Market, 2013
- Analysis Brief – International Retail Price Comparison, 2013
- NPDUIS CompassRx, 2nd Edition
- Private Drug Plans in Canada: Cost Driver Analysis, 2013
- New Drug Pipeline Monitor, 7th Edition
- New Drug Launch Monitor
- Orphan Drug Launch Monitor
- Utilization and Cost of Biologics, 2005/06 to 2012/13
- Private Drug Plans in Canada: High-Cost Drugs, 2013
Analysis of Research and Development Expenditures: R&D Investment Falling Short of Target
Innovation is vital to advancing health care. In part, the provisions of Canada’s Patent Act are intended to foster an investment climate favorable to pharmaceutical research and development (R&D) in Canada. However, the percentage of R&D-to-sales by pharmaceutical patentees in Canada has been falling since the late 1990’s and has been under the agreed-upon target of 10% since 2003. In 2014, it was at 4.4% for all patentees and 5.0% for members of Canada’s Research-Based Pharmaceutical Companies (Rx&D), its lowest point since the PMPRB began reporting on R&D in 1988.
In the Top 10 Global Markets
Canada is an Important Market for Pharmaceuticals
Canada has been consistently in the top 10 global markets for pharmaceuticals. Despite this, average R&D-to-sales ratios are 3 times higher for the PMPRB comparator countries, whereas prices in the majority of these countries are lower.
4.4% R&D-to-Sales Ratio
The R&D-to-Sales Ratio for all Patentees has Fallen to 4.4%
This represents a 166% decrease from a peak of 11.7% in 1995.
Analysis of Research and Development Expenditures
The Patent Act (Act) mandates the PMPRB to monitor and report on pharmaceutical research and development (R&D) spending (while giving the PMPRB no regulatory authority to consider the amount or type of patentees' research spending in the context of its price regulation). This chapter provides key statistics on the current state of pharmaceutical research investment in Canada.
Data Sources
The statistical results presented in this report were entirely derived from data that patentees submitted to the PMPRB.
The Act requires each patentee to report its total gross revenues from sales of all drugs for human or veterinary use (including revenues from sales of non-patented drug products and from licensing agreements) and R&D expenditures in Canada related to medicines (both patented and non-patented for human or veterinary use). Patentees transmit this information to the PMPRB by means of its Form 3 (Revenues and Research and Development Expenditures Provided Pursuant to subsection 88(1) of the Patent Act).
The Patented Medicines Regulations (Regulations) require that each submitted Form 3 be accompanied by a certificate stating the information it contains is “true and correct”. The Board does not audit Form 3 submissions, but it does review submitted data for anomalies and inconsistencies, seeking corrections or clarifications from patentees where necessary. To confirm that PMPRB staff has correctly interpreted the data submitted, each patentee is given the opportunity to review and confirm the accuracy of its own R&D-to-sales ratio before that ratio is published.
Failure to File
It is a patentee's responsibility to ensure a complete and accurate Form 3 is filed within the time frame set out in the Regulations. If a patentee fails to meet these filing requirements, the Board may issue an Order demanding compliance. There were no such Board Orders issued for the 2014 reporting period.
Coverage
Note that companies without sales of patented medicines do not need to report their R&D expenditures to the PMPRB. This has two implications.
First, the statistical results reported here should not be taken to cover all pharmaceutical research conducted in Canada. For example, a company may sell only non-patented drug products but may still perform considerable research in Canada. Similarly, a company may conduct research and have no product sales at all.Footnote 22 The results presented below will not reflect the R&D expenditures of firms in either situation.
Second, as new patented drug products come onto the Canadian market and existing patents expire, the number and identity of companies required to file R&D data may change from year to year. A total of 75 companies reported on their R&D activity in 2014. Of these, 35 were members of Canada's Research-Based Pharmaceutical Companies (Rx&D).
Definition of Sales Revenues
For reporting purposes, sales revenues are defined as total gross revenues from sales in Canada of all drug products and from licensing agreements (e.g., royalties and fees accruing to the patentee related to sales in Canada by licensees).
Definition of R&D Expenditures
Pursuant to section 6 of the Regulations, patentees are required to report R&D expenditures that would have qualified for an investment tax credit in respect to scientific research and experimental development (SR&ED) under the provisions of the Income Tax Act that came into effect on December 1, 1987.Footnote 23 By this definition, R&D expenditures may include current expenditures, capital equipment costs and allowable depreciation expenses. Market research, sales promotions, quality control or routine testing of materials, devices or products and routine data collection are not eligible for an investment tax credit and, therefore, are not to be included in the R&D expenditures reported by patentees.
Total Sales Revenues and R&D Expenditures
Table 16 provides an overview of reported sales revenues and R&D expenditures over the period 1988 through 2014.
Patentees reported total 2014 sales revenues of $16.8 billion, an increase of 0.1% from 2013. Sales revenues reported by Rx&D members were $13.2 billion, accounting for 78.7% of the total. (Less than 1% of reported sales revenues were generated by licensing agreements.)
Patentees reported R&D expenditures of $739.2 million in 2014, a decrease of 1.8% over 2013. Rx&D members reported R&D expenditures of $658.7 million in 2014, an increase of 1.0% over last year. Rx&D members accounted for 89.1% of all reported R&D expenditures in 2014.
R&D-to-Sales Ratios
Table 16 and Figure 20 also provide ratios of R&D expenditures to sales revenues. It should be noted in this context that, with the adoption of the 1987 amendments to the Act, Rx&D made a public commitment to increase their annual R&D expenditures to 10% of sales revenues by 1996.Footnote 24 This level of R&D expenditure was obtained by 1993, with the ratio exceeding 10% in some years. However, since 2003, R&D-to-sales ratios for all patentees and for Rx&D members have declined.
Figure 20. R&D-to-Sales Ratio, Pharmaceutical Patentees, 1988–2014
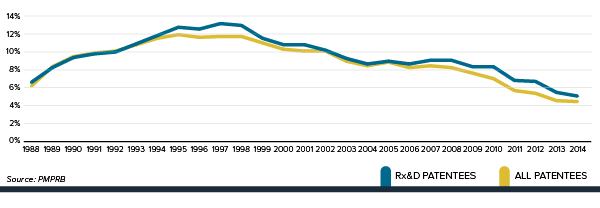
Figure description
Figure 20 is a line graph comparing the R&D-to-sales ratio of all patentees vs. Rx&D patentees based on data collected between 1988 and 2014.
Rx&D Patentees: 1988, 6.5; 1989, 8.1; 1990, 9.2; 1991, 9.6; 1992, 9.8; 1993, 10.7; 1994, 11.6; 1995, 12.5; 1996, 12.3; 1997, 12.9; 1998, 12.7; 1999, 11.3; 2000, 10.6; 2001, 10.6; 2002, 10; 2003, 9.1; 2004, 8.5; 2005, 8.8; 2006, 8.5; 2007, 8.9; 2008, 8.9; 2009, 8.2; 2010, 8.2; 2011, 6.7; 2012, 6.6; 2013, 5.4; 2014, 5.
All Patentees: 1988, 6.1; 1989, 8.2; 1990, 9.3; 1991, 9.7; 1992, 9.9; 1993, 10.6; 1994, 11.3; 1995, 11.7; 1996, 11.4; 1997, 11.5; 1998, 11.5; 1999, 10.8; 2000, 10.1; 2001, 9.9; 2002, 9.9; 2003, 8.8; 2004, 8.3; 2005, 8.7; 2006, 8.1; 2007, 8.3; 2008, 8.1; 2009, 7.5; 2010, 6.9; 2011, 5.6; 2012, 5.3; 2013, 4.5; 2014, 4.4.
The ratio of R&D expenditures to sales revenues among all patentees was 4.4% in 2014, down from 4.5% in 2013. These values are below figures last observed in 1988. The overall R&D-to-sales ratio has been less than 10% for the past 14 consecutive years.
The corresponding R&D-to-sales ratio for members of Rx&D was 5.0% in 2014, down from 5.4% in 2013.Footnote 25 These values are close to figures last observed in 1988. The Rx&D ratio has been less than 10% for the past 12 consecutive years.
Table 21 in Appendix 3 provides details on the range of 2014 R&D-to-sales ratios. Of the 75 companies reporting in 2014, 89.3% had R&D-to-sales ratios below 10%.
Table 16. Total R&D Expenditures and R&D-to-Sales Ratios of Reporting Companies, 1988–2014
| Year |
All Patentees |
Rx&D |
R&D-to- Sales Ratio: All Patentees (%) |
R&D-to- Sales Ratio: Rx&D Patentees (%) |
| Number of Companies Reporting |
R&D Expenditures by all Patentees ($Millions) |
Change From Previous Year (%) |
Sales Revenues ($Millions) |
Change From Previous Year (%) |
R&D Expenditures by Rx&D Patentees ($Millions) |
Change From Previous Year (%) |
Sales Revenues by Rx&D Patentees ($Millions) |
Change From Previous Year (%) |
| Source: PMPRB |
| 2014 |
75 |
739.2 |
-1.8 |
16,842.2 |
0.1 |
658.7 |
1.0 |
13,248.2 |
8.9 |
4.4 |
5.0 |
| 2013 |
81 |
752.8 |
-15.9 |
16,817.9 |
0.4 |
652.0 |
-16.7 |
12,167.6 |
2.3 |
4.5 |
5.4 |
| 2012 |
85 |
894.8 |
-9.8 |
16,754.4 |
-5.8 |
782.8 |
-13.1 |
11,896.1 |
-11.5 |
5.3 |
6.6 |
| 2011 |
79 |
991.7 |
-15.8 |
17,798.8 |
4.7 |
901.2 |
-9.9 |
13,446.1 |
10.7 |
5.6 |
6.7 |
| 2010 |
82 |
1,178.2 |
-7.4 |
17,000.0 |
-0.3 |
1,000.2 |
-11.7 |
12,149.0 |
-11.8 |
6.9 |
8.2 |
| 2009 |
81 |
1,272.0 |
-2.9 |
17,051.9 |
4.5 |
1,132.9 |
-3.4 |
13,780.0 |
4.6 |
7.5 |
8.2 |
| 2008 |
82 |
1,310.7 |
-1.1 |
16,316.7 |
2.0 |
1,172.2 |
-1.0 |
13,178.2 |
-1.4 |
8.1 |
8.9 |
| 2007 |
82 |
1,325.0 |
9.5 |
15,991.0 |
7.3 |
1,184.4 |
24.8 |
13,359.8 |
20.0 |
8.3 |
8.9 |
| 2006 |
72 |
1,210.0 |
-1.9 |
14,902.0 |
4.7 |
949.0 |
-8.8 |
11,131.2 |
-5.8 |
8.1 |
8.5 |
| 2005 |
80 |
1,234.3 |
5.5 |
14,231.3 |
0.5 |
1,040.1 |
3.9 |
11,821.4 |
0.0 |
8.7 |
8.8 |
| 2004 |
84 |
1,170.0 |
-2.0 |
14,168.3 |
4.0 |
1,000.8 |
0.8 |
11,819.0 |
8.8 |
8.3 |
8.5 |
| 2003 |
83 |
1,194.3 |
-0.4 |
13,631.1 |
12.8 |
992.9 |
-3.6 |
10,865.7 |
5.2 |
8.8 |
9.1 |
| 2002 |
79 |
1,198.7 |
13.0 |
12,081.2 |
12.5 |
1,029.6 |
10.1 |
10,323.8 |
16.8 |
9.9 |
10.0 |
| 2001 |
74 |
1,060.1 |
12.6 |
10,732.1 |
15.3 |
935.2 |
14.7 |
8,835.4 |
14.3 |
9.9 |
10.6 |
| 2000 |
79 |
941.8 |
5.3 |
9,309.6 |
12.0 |
815.5 |
4.0 |
7,728.8 |
11.6 |
10.1 |
10.6 |
| 1999 |
78 |
894.6 |
12.0 |
8,315.5 |
19.2 |
784.3 |
9.9 |
6,923.4 |
22.8 |
10.8 |
11.3 |
| 1998 |
74 |
798.9 |
10.2 |
6,975.2 |
10.9 |
713.7 |
8.6 |
5,640.2 |
10.6 |
11.5 |
12.7 |
| 1997 |
75 |
725.1 |
9.0 |
6,288.4 |
7.4 |
657.4 |
10.3 |
5,098.2 |
4.9 |
11.5 |
12.9 |
| 1996 |
72 |
665.3 |
6.4 |
5,857.4 |
9.9 |
595.8 |
6.5 |
4,859.5 |
8.7 |
11.4 |
12.3 |
| 1995 |
71 |
625.5 |
11.5 |
5,330.2 |
7.5 |
559.5 |
9.8 |
4,468.8 |
1.4 |
11.7 |
12.5 |
| 1994 |
73 |
561.1 |
11.4 |
4,957.4 |
4.4 |
509.5 |
10.4 |
4,407.2 |
2.0 |
11.3 |
11.6 |
| 1993 |
70 |
503.5 |
22.1 |
4,747.6 |
14.0 |
461.4 |
24.0 |
4,321.4 |
14.4 |
10.6 |
10.7 |
| 1992 |
71 |
412.4 |
9.6 |
4,164.4 |
6.9 |
372.1 |
9.0 |
3,778.4 |
6.5 |
9.9 |
9.8 |
| 1991 |
65 |
376.4 |
23.2 |
3,894.8 |
18.1 |
341.4 |
24.7 |
3,546.9 |
19.5 |
9.7 |
9.6 |
| 1990 |
65 |
305.5 |
24.8 |
3,298.8 |
11.0 |
273.8 |
25.8 |
2,967.9 |
10.5 |
9.3 |
9.2 |
| 1989 |
66 |
244.8 |
47.4 |
2,973.0 |
9.4 |
217.6 |
34.7 |
2,685.5 |
7.3 |
8.2 |
8.1 |
| 1988 |
66 |
165.7 |
— |
2,718.0 |
— |
161.5 |
— |
2,502.3 |
— |
6.1 |
6.5 |
Current Expenditures by Type of Research
Table 17 and Figure 21 (as well as Figure 23 in Appendix 3) provide information on the allocation of 2014 current R&D expendituresFootnote 26 among basic and applied research and other qualifying R&D.Footnote 27 Patentees reported spending $81.8 million on basic research in 2014, representing 11.5% of current R&D expenditures and an increase of 21.0% over the previous year. Patentees reported spending $456.1 million on applied research, representing 63.9% of current R&D expenditures. Clinical trials accounted for 69.7% of applied research expenditures.
Table 17. Current R&D Expenditures by Type of Research, 2014 and 2013
| Type of Research |
Expenditures:
2014
($Millions) |
Share:
2014
(%) |
Expenditures:
2013
($Millions) |
Share:
2013
(%) |
Annual
Change in
Expenditures
(%) |
| Basic |
81.8 |
11.5 |
67.6 |
9.3 |
21.0 |
| Chemical |
52.6 |
7.4 |
39.2 |
5.4 |
34.2 |
| Biological |
29.2 |
4.1 |
28.4 |
3.9 |
2.8 |
| Applied |
456.1 |
63.9 |
487.8 |
66.9 |
-6.5 |
| Manufacturing process |
51.4 |
7.2 |
70.5 |
9.7 |
-27.1 |
| Pre-clinical Trial I |
48.9 |
6.8 |
40.0 |
5.5 |
22.3 |
| Pre-clinical Trial II |
38.0 |
5.3 |
42.9 |
5.9 |
-11.4 |
| Clinical Trial Phase I |
25.4 |
3.6 |
35.8 |
4.9 |
-29.1 |
| Clinical Trial Phase II |
61.2 |
8.6 |
70.1 |
9.6 |
-12.7 |
| Clinical Trial Phase III |
231.2 |
32.4 |
228.5 |
31.3 |
1.2 |
| Other qualifying R&D |
176.1 |
24.7 |
173.9 |
23.8 |
1.3 |
| Total |
714.0 |
100.0* |
729.3 |
100.0* |
-2.1 |
* Values in this column may not add to 100.0 due to rounding
Source: PMPRB
Figure 21. Current R&D Expenditures by Type of Research, 1988–2014
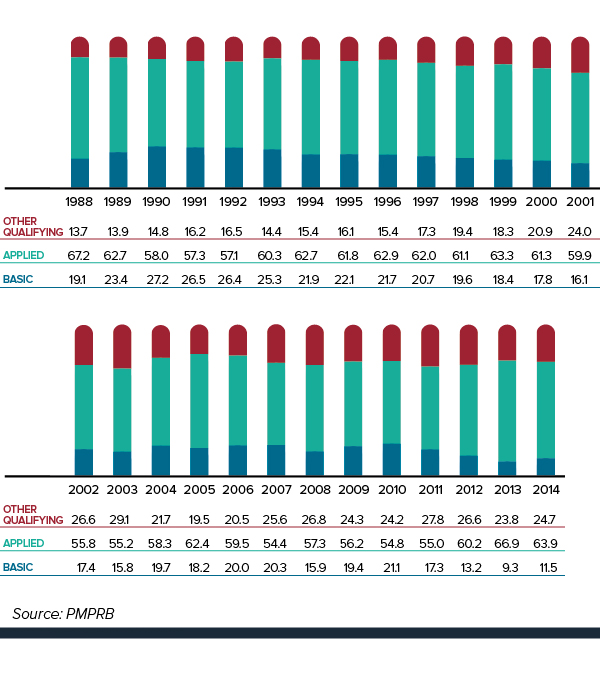
Figure description
This is a vertical stacked bar graph that depicts current R&D expenditures by type of research, based on data collected between 1988 and 2014, in percent. In 1988, basic types of research accounted for 19.1% of R&D expenditures. Applied types of research accounted for 67.2% of R&D expenditures. Other qualifying types of research accounted for 13.7% of R&D expenditures.
- 1989: Basic 23.4, Applied 62.7, Other Qualifying 13.9;
- 1990: Basic 27.2, Applied 58.0, Other Qualifying 14.8;
- 1991: Basic 26.5, Applied 57.3, Other Qualifying 16.2;
- 1992: Basic 26.4, Applied 57.1, Other Qualifying 16.5;
- 1993: Basic 25.3, Applied 60.3, Other Qualifying 14.4;
- 1994: Basic 21.9, Applied 62.7, Other Qualifying 15.4;
- 1995: Basic 22.1, Applied 61.8, Other Qualifying 16.1;
- 1996: Basic 21.7, Applied 62.9, Other Qualifying 15.4;
- 1997: Basic 20.7, Applied 62.0, Other Qualifying 17.3;
- 1998: Basic 19.6, Applied 61.1, Other Qualifying 19.4;
- 1999: Basic 18.4, Applied 63.3, Other Qualifying 18.3;
- 2000: Basic 17.8, Applied 61.3, Other Qualifying 20.9;
- 2001: Basic 16.1, Applied 59.9, Other Qualifying 24.0;
- 2002: Basic 17.4, Applied 55.8, Other Qualifying 26.6;
- 2003: Basic 15.8, Applied 55.2, Other Qualifying 29.1;
- 2004: Basic 19.7, Applied 58.3, Other Qualifying 21.7;
- 2005: Basic 18.2, Applied 62.4, Other Qualifying 19.5;
- 2006: Basic 20.0, Applied 59.5, Other Qualifying 20.5;
- 2007: Basic 20.3, Applied 54.4, Other Qualifying 25.6;
- 2008: Basic 15.9, Applied 57.3, Other Qualifying 26.8;
- 2009: Basic 19.4, Applied 56.2, Other Qualifying 24.3;
- 2010: Basic 21.1, Applied 54.8, Other Qualifying 24.2;
- 2011: Basic 17.3, Applied 55.0, Other Qualifying 27.8;
- 2012: Basic 13.2, Applied 60.2, Other Qualifying 26.6;
- 2013: Basic 9.3, Applied 66.9, Other Qualifying 23.8;
- 2014: Basic 11.5, Applied 63.9, Other Qualifying 24.7
Current R&D Expenditures by Performer
Patentees report expenditures on research they conduct themselves (intramural) and research performed by other establishments, such as universities, hospitals and other manufacturers (extramural). Table 18 shows that 48.9% of 2014 current research expenditures were intramural. Research performed by other companies on behalf of patentees was 25.0% of current expenditures, while research conducted in universities and hospitals accounted for 15.0%.
Table 18. Current R&D Expenditures by R&D Performer, 2014 and 2013
| R&D Performer |
Expenditures:
2014
($Millions) |
Share:
2014
(%) |
Expenditures:
2013
($Millions) |
Share:
2013
(%) |
Annual
Change
in
Expenditures
(%) |
* Values in this column may not add to 100.0 due to rounding
Source: PMPRB |
| Intramural |
| Patentees |
349.5 |
48.9 |
364.9 |
50.0 |
-4.2 |
| Extramural |
| Universities and hospitals |
107.1 |
15.0 |
94.7 |
13.0 |
13.0 |
| Other companies |
178.2 |
25.0 |
187.4 |
25.7 |
-3.8 |
| Others |
79.2 |
11.1 |
82.3 |
11.3 |
-4.9 |
| Total |
714.0 |
100.0* |
729.3 |
100.0* |
-2.1 |
Current R&D Expenditures by Source of Funds
Table 19 provides information on the sources of funds used by patentees to finance their R&D activity. Internal company funds remained by far the single largest source of funding in 2014, accounting for 87.9% of current expenditures. Funds received from government amounted to 1.3% of current expenditures.
Table 19. Total R&D Expenditures by Source of Funds, 2014 and 2013
| Source of Funds |
Expenditures:
2014
($Millions) |
Share:
2014
(%) |
Expenditures:
2013
($Millions) |
Share:
2013
(%) |
Annual
Change in
Expenditures
(%) |
| Company funds |
649.8 |
87.9 |
660.5 |
87.7 |
-1.6 |
| Federal/provincial governments |
9.8 |
1.3 |
10.8 |
1.4 |
-9.1 |
| Others |
79.6 |
10.8 |
81.5 |
10.8 |
-2.4 |
| Total |
739.2 |
100.0* |
752.8 |
100.0* |
-1.8 |
* Values in this column may not add to 100.0 due to rounding
Source: PMPRB
Current R&D Expenditures by Region
Table 20 (as well as Table 23 and Table 24 in Appendix 3) show current R&D expenditures by region. As in previous years, current expenditures were heavily concentrated in Ontario and Quebec in 2014, with these provinces accounting for 81.2% of total expenditures. While current R&D expenditures increased at a year-over-year rate of 21.5% in Western Canada, they increased by only 6.7% in Ontario and decreased in Quebec by 19.1%.
Table 20. Current R&D Expenditures by Region, 2014 and 2013
| Region |
Expenditures: 2014
($Millions) |
Share: 2014
(%) |
Expenditures: 2013
($Millions) |
Share: 2013
(%) |
Annual Change in
Expenditures
(%) |
| Atlantic provinces |
18.6 |
2.6 |
20.1 |
2.8 |
-7.7 |
| Quebec |
236.2 |
33.1 |
292.0 |
40.0 |
-19.1 |
| Ontario |
343.6 |
48.1 |
322.0 |
44.1 |
6.7 |
| Western provinces |
115.7 |
16.2 |
95.2 |
13.1 |
21.5 |
| Territories |
0.0 |
0.0 |
0.0 |
0.0 |
0.0 |
| Total |
714.0 |
100.0* |
729.3 |
100.0* |
-2.1 |
* Values in this column may not add to 100.0 due to rounding
Source: PMPRB
The Global Context
Figure 22 compares Canadian pharmaceutical R&D-to-sales ratios for the years 2000 and 2012 to those in the PMPRB’s seven comparator countries.Footnote 28 Canada’s ratio stood at 10.1% in 2000. Only Italy, at 6.2%, had a lower ratio in that year, while Switzerland had the highest ratio at 102.5%.
In 2012, Canada remained at the bottom of the range at 5.3%, with Italy second lowest at 6.1%. Ratios in all other comparator countries remained well above Canada’s ratio. The ratio obtained by aggregating R&D spending and sales across all seven comparator countries was 21.8%, three and a half times the value obtained for Canada.
Figure 22. R&D-to-Sales Ratios, Canada and Comparator Countries
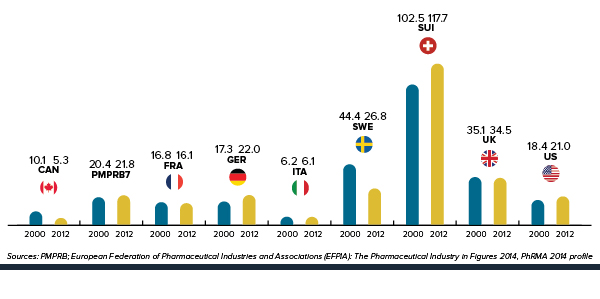
Figure description
This is a bar graph depicting R&D-to-sales ratios between Canada and comparator countries in 2000 and 2012.
2000: Canada, 10.1; All Comparators, 20.4; France, 16.8; Germany, 17.3; Italy, 6.2; Sweden, 44.4; Switzerland, 102.5; UK, 35.1; US, 18.4
2012: Canada, 5.3; All Comparators, 21.8; France, 16.1; Germany, 22.0; Italy, 6.1; Sweden, 26.8; Switzerland, 117.7; UK, 34.5; US, 21.0
The R&D-to-sales ratios represented in Figure 22 may be compared to the average bilateral price ratios reported in Table 11 (see Comparison of Canadian Prices to Foreign Prices section). Several comparator countries, which have patented drug prices that are, on average, substantially less than prices in Canada, have achieved R&D-to-sales ratios well above those in Canada.
As noted in last year’s report, there are a multitude of factors that drive the location of pharmaceutical R&D. These include where companies can find the best science base at reasonable cost and ready access to a quality clinical trials infrastructure. Although price levels are often cited as an important policy lever for attracting R&D, the data has not supported this link domestically or internationally.
Appendix 1: Glossary
For more detailed information and definitions please refer to the Patent Act, the Patented Medicines Regulations, the PMPRB Compendium of Policies, Guidelines and Procedures, and the Food and Drug Regulations, or contact the PMPRB.
Active Ingredient:
Chemical or biological substance responsible for the claimed pharmacologic effect of a drug product.
Advance Ruling Certificate (ARC):
A non-binding advance ruling certificate may be issued pursuant to subsection 98(4) of the Patent Act at the request of a patentee when the Board is satisfied that the price or proposed price of the medicine would not exceed the maximum non-excessive price under the Board's Guidelines.
ATC:
Anatomical Therapeutic Chemical (ATC) classification system, developed and maintained by the World Health Organization (WHO) Collaborating Centre for Drug Statistics Methodology, divides drugs into different groups according to their site of action and therapeutic and chemical characteristics. This system is used by the PMPRB as a guide for selecting comparable medicines for purposes of price review.
Dedication of Patent:
A practice whereby a patentee notifies the Commissioner of Patents that it has surrendered its rights and entitlements flowing from the patent for the benefit of the public to use and enjoy. NB: As of January 30, 1995, the Board does not recognize dedication of patent as a means to remove the medicine from its jurisdiction.
Drug Identification Number (DIN):
A registration number (drug identification number) that the Health Products and Food Branch of Health Canada assigns to each prescription and non-prescription drug product marketed under the Food and Drugs Regulations. The DIN is assigned using information in the following areas: manufacturer of the product; active ingredient(s); strength of active ingredient(s); pharmaceutical dosage form; brand/trade name; and route of administration.
Drug Product:
A particular presentation of a medicine characterized by its pharmaceutical dosage form and the strength of the active ingredient(s).
Failure to File:
The complete or partial failure of a patentee to comply with regulatory filing requirements pursuant to the Patent Act and the Patented Medicines Regulations.
Failure to Report:
The complete failure of a patentee to have reported a patented drug product being sold in accordance with regulatory filing requirements pursuant to the Patent Act and the Patented Medicines Regulations.
Generic Product:
A drug product with the same active ingredient, strength and dosage form of a brand name drug product.
License, Voluntary:
A contractual agreement between a patent holder and a licensee under which the licensee is entitled to enjoy the benefit of the patent or to exercise any rights in relation to the patent for some consideration (i.e., royalties in the form of a share of the licensee's sales).
Medicine:
Any substance or mixture of substances made by any means, whether produced biologically, chemically, or otherwise, that is applied or administered in vivo in humans or in animals to aid in the diagnosis, treatment, mitigation or prevention of disease, symptoms, disorders, abnormal physical states, or modifying organic functions in humans and or animals, however administered. For greater certainty, this definition includes vaccines, topical preparations, anaesthetics and diagnostic products used in vivo, regardless of delivery mechanism (e.g., transdermal, capsule form, injectable, inhaler, etc.). This definition excludes medical devices, in vitro diagnostic products and disinfectants that are not used in vivo.
Notice of Compliance (NOC):
Means a notice issued under section C.08.004 or C.08.004.01 of the Food and Drug Regulations. The issuance of an NOC indicates that a drug product meets the required Health Canada standards for use in humans or animals and that the product is approved for sale in Canada.
Patent:
An instrument issued by the Commissioner of Patents in the form of letters patent for an invention that provides its holder with a monopoly limited in time, for the claims made within the patent. A patent gives its holder and its legal representatives, the exclusive right of making, constructing and using the invention and selling it to others to be used.
Patented Medicines Price Index (PMPI):
The PMPI was developed by the PMPRB as a measure of average year-over-year change in the transaction prices of patented drug products sold in Canada, based on the price and sales information reported by patentees.
Patentee:
As defined by subsection 79(1) of the Patent Act, “the person for the time being entitled to the benefit of the patent for that invention and includes, where any other person is entitled to exercise any rights in relation to that patent other than under a license continued by subsection 11(1) of the Patent Act Amendment Act, 1992, that other person in respect of those rights.”
Pending Patent:
An application for a patent that has not yet been issued.
Research and Development (R&D):
Basic or applied research for the purpose of creating new, or improving existing, materials, devices, products or processes (e.g., manufacturing processes).
Research and Development—Basic Research:
R&D directed toward a specific practical application, comprising research intended to improve manufacturing processes, pre-clinical trials and clinical trials.
Research and Development—Other Qualifying:
Includes eligible research and development expenditures that cannot be classified into any of the preceding categories of “type of research and development”. It includes drug regulation submissions, bioavailability studies and Phase IV clinical trials.
Research and Development Expenditures:
For the purposes of the Patented Medicines Regulations, in particular Sections 5 and 6, research and development includes activities for which expenditures would have qualified for the investment tax credit for scientific research and experimental development under the Income Tax Act as it read on December 1, 1987.
Research and Development Expenditures—Current:
Consist of the following non-capital expenses that are directly related to research work: (a) wages and salaries, (b) direct material, (c) contractors and subcontractors, (d) other direct costs such as factory overhead, (e) payments to designated institutions, (f) payments to granting councils, and (g) payments to other organizations. These elements are described in greater detail in the Patentees' Guide to Reporting— Form 3, available from the PMPRB Website under Regulatory Filings.
Special Access Programme (SAP):
A program operated by Health Canada to give practitioners access to drugs that are not approved or otherwise available for sale in Canada.
Voluntary Compliance Undertaking (VCU):
A written undertaking by a patentee to adjust its price to comply to the Board's Guidelines. The Chairperson may accept a VCU in lieu of issuing a Notice of Hearing if it is in the public interest. A VCU can also be submitted following the issuance of a Notice of Hearing. A VCU submitted at this point must be approved by the Board Hearing Panel struck to hear the matter. The Board reports publicly on all VCUs accepted by the Chairperson or the Board.
Appendix 2: Patented Drug Products First Reported to the PMPRB in 2014
blank
|
Brand Name |
Company |
DIN |
Status |
Level of therapeutic improvement/
category* |
| 1 |
CREON MINIMICROSPHERES - 6000 unit/capsule |
Abbott Laboratories Limited |
02415194 |
Within Guidelines |
SN |
| 2 |
CONSTELLA - 145 mcg/capsule |
Actavis Specialty Pharmaceuticals Co. |
02417162 |
Within Guidelines |
SN |
| 3 |
CONSTELLA - 290 mcg/capsule |
Actavis Specialty Pharmaceuticals Co. |
02417170 |
Under Review |
blank |
| 4 |
FIBRISTAL - 5 mg/tablet |
Actavis Specialty Pharmaceuticals Co. |
02408163 |
Under Review |
blank |
| 5 |
LOLO 1/0.1 |
Actavis Specialty Pharmaceuticals Co. |
02417456 |
Within Guidelines |
SN |
| 6 |
CARIPUL - 0.5 mg/vial |
Actelion Pharmaceuticals Canada Inc. |
02397447 |
Under Review |
blank |
| 7 |
CARIPUL - 1.5 mg/vial |
Actelion Pharmaceuticals Canada Inc. |
02397455 |
Under Review |
blank |
| 8 |
OPSUMIT - 10 mg/tablet |
Actelion Pharmaceuticals Canada Inc. |
02415690 |
Within Guidelines |
SN |
| 9 |
XIAFLEX - 0.9 mg/vial |
Actelion Pharmaceuticals Canada Inc. |
02388316 |
Within Guidelines |
B |
| 10 |
JUXTAPID - 5 mg/capsule |
Aegerion Pharmaceuticals (Canada) Ltd. |
02420341 |
Within Guidelines |
MI-P |
| 11 |
JUXTAPID - 10 mg/capsule |
Aegerion Pharmaceuticals (Canada) Ltd. |
02420376 |
Within Guidelines |
MI-P |
| 12 |
JUXTAPID - 20 mg/capsule |
Aegerion Pharmaceuticals (Canada) Ltd. |
02420384 |
Within Guidelines |
MI-P |
| 13 |
ILEVRO - 3 mg/mL |
Alcon Canada Inc. |
02411393 |
Within Guidelines |
SN |
| 14 |
FLUMIST QUADRIVALENT - 0.2 unit/dose |
AstraZeneca Canada Inc. |
02426544 |
Under Review |
blank |
| 15 |
EYLEA - 40 mg/mL |
Bayer Inc. |
02415992 |
Within Guidelines |
MI-S |
| 16 |
XOFIGO - 1000 kBq/mL |
Bayer Inc. |
blank |
Under Review |
blank |
| 17 |
TECFIDERA - 240 mg/capsule |
Biogen Idec Canada Inc. |
02420201 |
Subject to Investigation |
SN |
| 18 |
GIOTRIF - 20 mg/tablet |
Boehringer Ingelheim (Canada) Ltd. |
02415666 |
Within Guidelines |
SN |
| 19 |
GIOTRIF - 30 mg/tablet |
Boehringer Ingelheim (Canada) Ltd. |
02415674 |
Within Guidelines |
SN |
| 20 |
GIOTRIF - 40 mg/tablet |
Boehringer Ingelheim (Canada) Ltd. |
02415682 |
Within Guidelines |
SN |
| 21 |
ISTODAX - 10 mg/vial |
Celgene Inc. |
02414295 |
Within Guidelines |
SN |
| 22 |
POMALYST - 1 mg/capsule |
Celgene Inc. |
02419580 |
Within Guidelines |
SI |
| 23 |
POMALYST - 2 mg/capsule |
Celgene Inc. |
02419599 |
Within Guidelines |
SI |
| 24 |
POMALYST - 3 mg/capsule |
Celgene Inc. |
02419602 |
Within Guidelines |
SI |
| 25 |
POMALYST - 4 mg/capsule |
Celgene Inc. |
02419610 |
Within Guidelines |
SI |
| 26 |
NOCDURNA - 50 mcg/tablet |
Ferring Pharmaceuticals Inc. |
02431076 |
Within Guidelines |
SN |
| 27 |
ONRELTEA - 5 mg/gram |
Galderma Canada Inc. |
02421208 |
Subject to Investigation |
SN |
| 28 |
GD-AZITHROMYCIN - 20 mg/mL |
GenMed |
02274566 |
Within Guidelines |
SN |
| 29 |
GD-AZITHROMYCIN - 40 mg/mL |
GenMed |
02274574 |
Within Guidelines |
SN |
| 30 |
GD-CELECOXIB - 100 mg/capsule |
GenMed |
02291975 |
Within Guidelines |
SN |
| 31 |
GD-CELECOXIB - 200 mg/capsule |
GenMed |
02291983 |
Within Guidelines |
SN |
| 32 |
GD-QUINAPRIL - 5 mg/tablet |
GenMed |
02290987 |
Within Guidelines |
SN |
| 33 |
GD-QUINAPRIL - 10 mg/tablet |
GenMed |
02290995 |
Within Guidelines |
SN |
| 34 |
GD-QUINAPRIL - 20 mg/tablet |
GenMed |
02291002 |
Within Guidelines |
SN |
| 35 |
GD-QUINAPRIL - 40 mg/tablet |
GenMed |
02291010 |
Within Guidelines |
SN |
| 36 |
HARVONI 90/400 |
Gilead Sciences Inc. |
02432226 |
Within Guidelines |
SN |
| 37 |
SOVALDI - 400 mg/tablet |
Gilead Sciences Inc. |
02418355 |
Within Guidelines |
SI |
| 38 |
ANORO ELLIPTA 62.5/25 |
GlaxoSmithKline Inc. |
02418401 |
Within Guidelines |
SN |
| 39 |
ROTARIX |
GlaxoSmithKline Inc. |
02300591 |
Within Guidelines |
3 |
| 40 |
ACTEMRA - 162 mg/syringe |
Hoffmann-La Roche Limited, Canada |
02424770 |
Within Guidelines |
MI-S |
| 41 |
GAZYVA - 25 mg/mL |
Hoffmann-La Roche Limited, Canada |
02434806 |
Under Review |
blank |
| 42 |
IMBRUVICA - 140 mg/capsule |
Janssen Inc. |
02434407 |
Under Review |
blank |
| 43 |
INVOKANA - 100 mg/tablet |
Janssen Inc. |
02425483 |
Under Review |
blank |
| 44 |
INVOKANA - 300 mg/tablet |
Janssen Inc. |
02425491 |
Within Guidelines |
SN |
| 45 |
NUCYNTA XR - 50 mg/tablet |
Janssen Inc. |
02415577 |
Within Guidelines |
SN |
| 46 |
NUCYNTA XR - 100 mg/tablet |
Janssen Inc. |
02415585 |
Within Guidelines |
SN |
| 47 |
NUCYNTA XR - 150 mg/tablet |
Janssen Inc. |
02415593 |
Within Guidelines |
SN |
| 48 |
NUCYNTA XR - 200 mg/tablet |
Janssen Inc. |
02415607 |
Within Guidelines |
SN |
| 49 |
NUCYNTA XR - 250 mg/tablet |
Janssen Inc. |
02415615 |
Within Guidelines |
SN |
| 50 |
PREZCOBIX 800/150 |
Janssen Inc. |
02426501 |
Within Guidelines |
SN |
| 51 |
SIMPONI - 50 mg/vial |
Janssen Inc. |
02417472 |
Within Guidelines |
SN |
| 52 |
TRINTELLIX - 5 mg/tablet |
Lundbeck Canada Inc. |
02432919 |
Under Review |
blank |
| 53 |
TRINTELLIX - 10 mg/tablet |
Lundbeck Canada Inc. |
02432927 |
Under Review |
blank |
| 54 |
TRINTELLIX - 20 mg/tablet |
Lundbeck Canada Inc. |
02432943 |
Under Review |
blank |
| 55 |
GRASTEK - 2800 unit/tablet |
Merck Canada Inc. |
02418394 |
Within Guidelines |
SN |
| 56 |
JANUMET XR 50/1000 |
Merck Canada Inc. |
02416784 |
Subject to Investigation |
SN |
| 57 |
POSANOL - 100 mg/tablet |
Merck Canada Inc. |
02424622 |
Does Not Trigger Investigation |
SN |
| 58 |
POSANOL - 300 mg/vial |
Merck Canada Inc. |
02432676 |
Under Review |
blank |
| 59 |
RAGWITEK - 12 unit/tablet |
Merck Canada Inc. |
02423723 |
Within Guidelines |
MI-S |
| 60 |
AFINITOR DISPERZ - 2 mg/tablet |
Novartis Pharmaceuticals Canada Inc. |
02425645 |
Within Guidelines |
SN |
| 61 |
AFINITOR DISPERZ - 3 mg/tablet |
Novartis Pharmaceuticals Canada Inc. |
02425653 |
Within Guidelines |
SN |
| 62 |
AFINITOR DISPERZ - 5 mg/tablet |
Novartis Pharmaceuticals Canada Inc. |
02425661 |
Within Guidelines |
SN |
| 63 |
BEXSERO |
Novartis Pharmaceuticals Canada Inc. |
02417030 |
Subject to Investigation |
B |
| 64 |
LUCENTIS - 0.5 mg/dose |
Novartis Pharmaceuticals Canada Inc. |
02425629 |
Under Review |
blank |
| 65 |
ULTIBRO BREEZHALER 110/50 |
Novartis Pharmaceuticals Canada Inc. |
02418282 |
Within Guidelines |
SN |
| 66 |
NORDITROPIN NORDIFLEX - 5 mg/pen |
Novo Nordisk Canada Inc. |
02334852 |
Under Review |
blank |
| 67 |
NORDITROPIN NORDIFLEX - 10 mg/pen |
Novo Nordisk Canada Inc. |
02334860 |
Under Review |
blank |
| 68 |
NORDITROPIN NORDIFLEX - 15 mg/pen |
Novo Nordisk Canada Inc. |
02334879 |
Under Review |
blank |
| 69 |
ABILIFY MAINTENA - 300 mg/vial |
Otsuka Canada |
02320864 |
Within Guidelines |
SN |
| 70 |
ABILIFY MAINTENA - 400 mg/vial |
Otsuka Canada |
02420872 |
Within Guidelines |
SN |
| 71 |
ANTIZOL - 1 g/mL |
Paladin Labs Inc. |
02242980 |
Under Review |
blank |
| 72 |
VEREGEN - 100 mg/gram |
Paladin Labs Inc. |
02411849 |
Under Review |
blank |
| 73 |
BOSULIF - 100 mg/tablet |
Pfizer Canada Inc. |
02419149 |
Within Guidelines |
SN |
| 74 |
BOSULIF - 500 mg/tablet |
Pfizer Canada Inc. |
02419157 |
Within Guidelines |
SN |
| 75 |
CYTARABINE - 20 mg/mL |
Pfizer Canada Inc. |
02406764 |
Within Guidelines |
SN |
| 76 |
CYTARABINE - 100 mg/mL |
Pfizer Canada Inc. |
02406772 |
Within Guidelines |
SN |
| 77 |
ELELYSO - 200 unit/vial |
Pfizer Canada Inc. |
02425637 |
Within Guidelines |
SN |
| 78 |
IRINOTECAN - 20 mg/mL |
Pfizer Canada Inc. |
02410419 |
Subject to Investigation |
SN |
| 79 |
XELJANZ - 5 mg/tablet |
Pfizer Canada Inc. |
02423898 |
Under Review |
blank |
| 80 |
ZALTRAP - 100 mg/vial |
sanofi-aventis Canada Inc. |
02421070 |
Within Guidelines |
SN |
| 81 |
ZALTRAP - 200 mg/vial |
sanofi-aventis Canada Inc. |
02421089 |
Within Guidelines |
SN |
| 82 |
APTIOM - 200 mg/tablet |
Sunovion Pharmaceuticals Canada Inc. |
02426862 |
Under Review |
blank |
| 83 |
APTIOM - 400 mg/tablet |
Sunovion Pharmaceuticals Canada Inc. |
02426870 |
Under Review |
blank |
| 84 |
APTIOM - 600 mg/tablet |
Sunovion Pharmaceuticals Canada Inc. |
02426889 |
Under Review |
blank |
| 85 |
APTIOM - 800 mg/tablet |
Sunovion Pharmaceuticals Canada Inc. |
02426897 |
Under Review |
blank |
| 86 |
LATUDA - 20 mg/tablet |
Sunovion Pharmaceuticals Canada Inc. |
02422050 |
Within Guidelines |
SN |
| 87 |
LATUDA - 60 mg/tablet |
Sunovion Pharmaceuticals Canada Inc. |
02413361 |
Within Guidelines |
SN |
| 88 |
KAZANO 12.5/500 |
Takeda Canada Inc. |
02417219 |
Within Guidelines |
SN |
| 89 |
KAZANO 12.5/850 |
Takeda Canada Inc. |
02417227 |
Subject to Investigation |
SN |
| 90 |
KAZANO 12.5/1000 |
Takeda Canada Inc. |
02417235 |
Within Guidelines |
SN |
| 91 |
NESINA - 6.25 mg/tablet |
Takeda Canada Inc. |
02417189 |
Subject to Investigation |
SN |
| 92 |
NESINA - 12.5 mg/tablet |
Takeda Canada Inc. |
02417197 |
Subject to Investigation |
SN |
| 93 |
NESINA - 25 mg/tablet |
Takeda Canada Inc. |
02417200 |
Within Guidelines |
SN |
| 94 |
FENTORA - 100 mcg/tablet |
Teva Canada Innovation |
02408007 |
Within Guidelines |
SN |
| 95 |
FENTORA - 200 mcg/tablet |
Teva Canada Innovation |
02408015 |
Within Guidelines |
SN |
| 96 |
FENTORA - 400 mcg/tablet |
Teva Canada Innovation |
02408023 |
Within Guidelines |
SN |
| 97 |
FENTORA - 600 mcg/tablet |
Teva Canada Innovation |
02408031 |
Within Guidelines |
SN |
| 98 |
FENTORA - 800 mcg/tablet |
Teva Canada Innovation |
02408058 |
Within Guidelines |
SN |
| 99 |
NEUPRO - 1 mg/patch |
UCB Canada Inc. |
02403897 |
Within Guidelines |
SN |
| 100 |
NEUPRO - 3 mg/patch |
UCB Canada Inc. |
02403919 |
Within Guidelines |
SN |
| 101 |
JUBLIA - 10 mg/gram |
Valeant Canada LP |
02413388 |
Under Review |
blank |
| 102 |
VYLOMA - 250 mg/pouch |
Valeant Canada LP |
02356661 |
Within Guidelines |
SN |
| 103 |
TRIUMEQ 50/600/300 |
Viiv Healthcare ULC |
02430932 |
Under Review |
blank |
*Sold after implementation of new Guidelines in 2010:
- SN Slight or No Improvement
- MI-S Moderate Improvement – Secondary
- MI-P Moderate Improvement – Primary
- SI Substantial Improvement
- B Breakthrough
Sold prior to implementation of new Guidelines in 2010:
Category 1 An existing or comparable dosage form of an existing medicine
Category 2 A non-comparable dosage form of an existing medicine, or the first DIN of a new chemical entity that is a breakthrough or provides a substantial improvement over comparable existing DINs
Category 3 A non-comparable dosage form of an existing medicine, or the first DIN of a new chemical entity that provides moderate, little or no therapeutic advantage over comparable existing DINs
Appendix 3: Research and Development
Table 21. Range of R&D-to-Sales Ratios by Number of Reporting Companies and Total Sales Revenue
| Range: R&D-to-Sales Ratio |
Number of Reporting Companies: 2014 |
Sales Revenues: 2014 ($Millions) Range: R&D-to-Sales Ratio |
Share: 2014(%) |
Number of Reporting Companies: 2013 |
Sales Revenues: 2013 ($Millions) |
Share: 2013(%) |
| 0% |
28 |
2,008.8 |
11.9 |
33 |
2,744.5 |
16.3 |
| ≤10% |
39 |
14,028.0 |
83.2 |
37 |
13,210.3 |
78.5 |
| >10% |
8 |
805.4 |
4.8 |
11 |
863.1 |
5.1 |
| Total |
75 |
16,842.2 |
100.0* |
81 |
16,817.9 |
100.0* |
* Values in this column may not add to 100.0 due to rounding
Source: PMPRB
Figure 23. Current R&D Expenditures ($millions) by Type of Research, 1988–2014
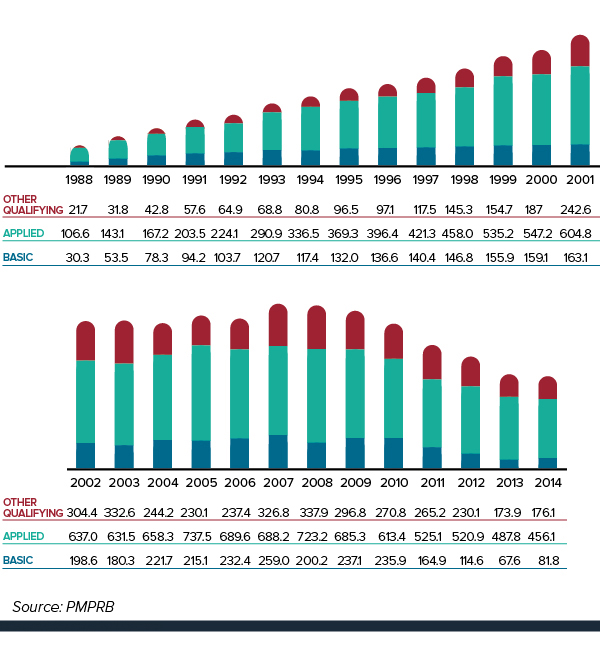
Figure description
This is a vertical stacked bar graph depicting the current R&D expenditures, in millions of dollars, by type of research, based on data collected between 1988 and 2014.
| Year |
Basic |
Applied |
Other Qualifying |
| 1988 |
30.3 |
106.6 |
21.7 |
| 1989 |
53.5 |
143.1 |
31.8 |
| 1990 |
78.3 |
167.2 |
42.8 |
| 1991 |
94.2 |
203.5 |
57.6 |
| 1992 |
103.7 |
224.1 |
64.9 |
| 1993 |
120.7 |
290.9 |
68.8 |
| 1994 |
117.4 |
336.5 |
80.8 |
| 1995 |
132.0 |
369.3 |
96.5 |
| 1996 |
136.6 |
396.4 |
97.1 |
| 1997 |
140.4 |
421.3 |
117.5 |
| 1998 |
146.8 |
458.0 |
145.3 |
| 1999 |
155.9 |
535.2 |
154.7 |
| 2000 |
159.1 |
547.2 |
187.0 |
| 2001 |
163.1 |
604.8 |
242.6 |
| 2002 |
198.6 |
637.0 |
304.4 |
| 2003 |
180.3 |
631.5 |
332.6 |
| 2004 |
221.7 |
658.3 |
244.2 |
| 2005 |
215.1 |
737.5 |
230.1 |
| 2006 |
232.4 |
689.6 |
237.4 |
| 2007 |
259.0 |
688.2 |
326.8 |
| 2008 |
200.2 |
723.2 |
337.9 |
| 2009 |
237.1 |
685.3 |
296.8 |
| 2010 |
235.9 |
613.4 |
270.8 |
| 2011 |
164.9 |
525.1 |
265.2 |
| 2012 |
114.6 |
520.9 |
230.1 |
| 2013 |
67.6 |
487.8 |
173.9 |
| 2014 |
81.8 |
456.1 |
176.1 |
Table 22. Ratios of R&D Expenditures to Sales Revenue by Reporting Patentee1, 2014 and 2013
| Company |
R&D-to-Sales Ratio (%) 2014 |
R&D-to-Sales Ratio (%) 2013 |
| Abbott Laboratories, Ltd.2 |
0.0 |
0.0 |
| AbbVie Corporation2, 3, 4 |
2.2 |
2.2 |
| Actavis Specialty Pharmaceuticals Co. (Watson Pharma Co.) |
0.1 |
0.0 |
| Actelion Pharmaceuticals Canada Inc.2, 3, 4 |
4.2 |
— |
| Aegerion Pharma Canada Ltd.3, 5 |
1.9 |
— |
| Alcon Canada Inc. |
0.1 |
0.1 |
| Alexion Pharmaceuticals Inc.3 |
0.0 |
0.0 |
| Allergan Inc. |
5.0 |
3.8 |
| Almirall Limited2 |
0.0 |
59.2 |
| Alveda Pharmaceuticals Inc. |
0.0 |
0.0 |
| Amgen Canada Inc.2, 3 |
6.0 |
7.0 |
| Aspri Pharma Canada Inc.5 |
0.0 |
— |
| Astellas Pharma Canada Inc.2, 6 |
2.0 |
3.3 |
| AstraZeneca Canada Inc.2, 3 |
3.0 |
1.8 |
| Baxter Corporation |
0.3 |
0.4 |
| Bayer Inc.2 |
5.2 |
4.3 |
| Biogen Idec Canada Inc.3 |
10.2 |
10.3 |
| BioMarin Canada Inc.3 |
42.5 |
19.2 |
| Biovitrum AB |
0.0 |
0.0 |
| Boehringer Ingelheim (Canada) Ltd.2 |
4.5 |
5.8 |
| Bracco Diagnostics Canada Inc. |
0.0 |
0.0 |
| Bristol-Myers Squibb Canada2, 3 |
9.7 |
12.0 |
| Celgene Inc.3 |
2.0 |
1.2 |
| Correvio (UK) Ltd. (Iroko International LP) |
0.0 |
0.0 |
| CSL Behring Canada Inc. |
0.5 |
0.8 |
| Cubist Pharmaceuticals Canada, Inc. (Optimer Pharmaceuticals Canada Inc.) |
0.0 |
0.0 |
| Duchesnay Inc. |
12.5 |
9.4 |
| Eisai Limited2, 3 |
0.9 |
12.3 |
| Eli Lilly Canada Inc. (includes Provel Animal Health Division)2, 3 |
4.3 |
9.6 |
| EMD Serono Canada Inc.2 |
5.8 |
5.9 |
| Ferring Pharmaceuticals Inc.2 |
0.0 |
0.0 |
| Galderma Canada Inc. |
0.0 |
0.0 |
| Gilead Sciences Canada, Inc.2 |
22.6 |
19.5 |
| GlaxoSmithKline Inc.2 |
8.5 |
9.7 |
| Grifols Canada Ltd. (Talecris Biotherapeutics Ltd.)3 |
0.0 |
0.0 |
| Hoffmann-La Roche Ltd. Canada2 |
4.9 |
4.7 |
| Hospira Healthcare Corp. |
0.0 |
0.0 |
| Janssen Inc.2, 3 |
3.3 |
3.1 |
| Johnson & Johnson Inc. |
0.0 |
0.0 |
| Johnson & Johnson Medical Products |
1.7 |
0.0 |
| Lantheus MI Canada Inc. |
0.0 |
0.0 |
| LEO Pharma Inc.2 |
1.2 |
0.9 |
| Lundbeck Canada Inc.2 |
0.8 |
0.3 |
| McNeil Consumer Healthcare Canada |
3.8 |
2.9 |
| Meda Valeant Pharma Canada Ltd. |
0.0 |
0.0 |
| Medical Futures Inc. |
0.0 |
0.0 |
| Merck Canada Inc.2, 3 |
2.4 |
1.7 |
| Merus Labs |
0.0 |
0.0 |
| Merz Pharma Canada Ltd. |
5.8 |
6.6 |
| Novartis Pharmaceuticals Canada Inc.2, 3 |
6.4 |
9.4 |
| Novo Nordisk Canada Inc.2, 3 |
2.9 |
1.3 |
| Orion Corporation.5 |
0.0 |
- |
| Otsuka Canada Pharmaceutical Inc. (OCPI)2 |
48.0 |
39.1 |
| Paladin Labs Inc.2 |
0.0 |
0.0 |
| Pfizer Canada Inc.2, 3 |
1.2 |
1.7 |
| Purdue Pharma2 |
4.6 |
4.9 |
| Ranbaxy Pharmaceuticals Canada Inc. |
0.0 |
0.0 |
| Salix Pharmaceuticals Inc. |
45.9 |
130.7 |
| Sanofi Canada Inc.2, 8 |
2.4 |
3.7 |
| Sanofi Pasteur Ltd.2, 3, 7 |
67.1 |
69.7 |
| Seattle Genetics Inc. |
5.2 |
6.6 |
| Servier Canada Inc.2 |
4.7 |
4.6 |
| Shire Canada Inc.2, 3 |
0.2 |
0.2 |
| Shire Human Genetic Therapies2, 3 |
1.6 |
1.2 |
| Sigma Tau Pharmaceuticals Inc. |
0.0 |
0.0 |
| Sunovion Pharmaceuticals Canada Inc.2 |
0.0 |
0.0 |
| Takeda Canada Inc.2, 3 |
0.0 |
0.0 |
| Teva Canada Innovation3 |
0.7 |
0.9 |
| Tribute Pharma Canada Inc. |
0.0 |
0.0 |
| Tyco Healthcare Group Canada Inc. (Mallinckrodt Pharmaceuticals, LLC) |
0.0 |
0.0 |
| UCB Canada Inc.3 |
1.7 |
7.9 |
| Valeant Canada Ltd.3, 9 |
0.0 |
0.0 |
| Vertex Pharma Canada Inc. |
66.5 |
21.3 |
| Vetoquinol Canada Inc. |
1.9 |
2.8 |
| VIIV Healthcare ULC2 |
0.0 |
0.0 |
1 To avoid double counting of sales revenues, revenues from royalties are included in calculating each company’s ratio but not included in calculating industry-wide ratios. Federal and provincial government grants are subtracted from the R&D expenditure in calculating individual R&D-to-sales ratios but are included in calculating industry-wide ratios. Differences between the list of firms filing data on prices and those filing R&D data are due to differences in reporting practices of patentees and their affiliates or licensees. Note as well that some veterinary patentees (i.e., those without revenue from sales of products for human use) are required to file information on R&D expenditure but not price and sales information.
2 Member of Rx&D.
3 Member of BIOTECanada.
4 Spin-off of Abbott’s proprietary products division into a separate legal entity effective Oct. 31, 2012.
5 Not a patentee in 2013.
6 Formerly known as Fujisawa Canada Inc.
7 Formerly known as Aventis Pasteur Ltd.
8 Formerly known as Aventis Pharma Inc.
9 Formerly known as ICN Canada Ltd.
Table 23. Current R&D Expenditures by Province/Territory, 2014
| Province |
Expenditures: All Patentees ($Thousands) |
Regional Share (%) |
Expenditures: Rx&D ($Thousands) |
Regional Share: (%) |
| Newfoundland |
3,257.85 |
0.456 |
2,915.79 |
0.459 |
| Prince Edward Island |
2.07 |
0.00 |
2.07 |
0.000 |
| Nova Scotia |
13,492.91 |
1.890 |
12,209.82 |
1.922 |
| New Brunswick |
1,811.68 |
0.254 |
1,457.57 |
0.229 |
| Quebec |
236,197.38 |
33.080 |
203,269.39 |
31.991 |
| Ontario |
343,568.69 |
48.118 |
311,605.53 |
49.042 |
| Manitoba |
4,734.09 |
0.663 |
4,101.09 |
0.645 |
| Saskatchewan |
1,586.18 |
0.222 |
1,092.00 |
0.172 |
| Alberta |
76,177.32 |
10.669 |
70,018.22 |
11.020 |
| British Columbia |
33,187.85 |
4.648 |
28,714.54 |
4.519 |
| Territories |
0 |
0.000 |
0 |
0.000 |
| Canada |
714,016.02 |
100.0* |
635,386.02 |
100.0* |
* Values in this column may not add to 100.0 due to rounding.
Source: PMPRB
Table 24. Current R&D Expenditures by Performer and Province/Territory, 2014
| Province |
blank |
Patentees |
Other Companies |
University |
Hospitals |
Others |
| Newfoundland |
$000 |
661.62 |
1,258.67 |
599.90 |
142.36 |
595.30 |
| blank |
% |
20.3 |
38.6 |
18.4 |
4.4 |
18.3 |
| Prince Edward Island |
$000 |
0.00 |
0.00 |
0.0 |
2.07 |
0.00 |
| blank |
% |
0.0 |
0.0 |
0.0 |
100.0 |
0.0 |
| Nova Scotia |
$000 |
1,096.22 |
2,851.22 |
5,356.77 |
2,375.28 |
1,813.41 |
| blank |
% |
8.1 |
21.1 |
39.7 |
17.6 |
13.4 |
| New Brunswick |
$000 |
122.06 |
776.47 |
0.17 |
558.59 |
354.39 |
| blank |
% |
6.7 |
42.9 |
0.01 |
30.8 |
19.6 |
| Quebec |
$000 |
92,343.03 |
82,861.12 |
9,669.42 |
16,514.58 |
34,809.23 |
| blank |
% |
39.1 |
35.1 |
4.1 |
7.0 |
14.7 |
| Ontario |
$000 |
185,955.44 |
72,319.00 |
19,762.42 |
34,625.46 |
30,906.37 |
| blank |
% |
54.1 |
21.0 |
5.6 |
10.1 |
9.0 |
| Manitoba |
$000 |
745.59 |
1,483.84 |
513.10 |
1,084.57 |
906.99 |
| blank |
% |
15.7 |
31.3 |
10.8 |
22.9 |
19.2 |
| Saskatchewan |
$000 |
277.27 |
840.32 |
279.75 |
130.99 |
57.85 |
| blank |
% |
17.5 |
52.9 |
17.6 |
8.3 |
3.6 |
| Alberta |
$000 |
55,162.62 |
6,553.60 |
7,433.41 |
2,993.73 |
4,033.95 |
| blank |
% |
72.4 |
8.6 |
9.7 |
3.4 |
5.3 |
| British Columbia |
$000 |
13,184.99 |
9,236.55 |
2,161.37 |
2,849.56 |
5,755.38 |
| blank |
% |
39.7 |
27.8 |
6.5 |
8.6 |
17.3 |
| Territories |
$000 |
0.0 |
0.0 |
0.0 |
0.0 |
0.0 |
| blank |
% |
0.0 |
0.0 |
0.0 |
0.0 |
0.0 |
| Canada |
$000 |
349,548.85 |
178,180.78 |
45,776.31 |
61,277.21 |
79,232.87 |
| blank |
% |
49.0 |
25.0 |
6.4 |
8.6 |
11.1 |
Notes:
- The percentage under each R&D category gives the percentage of all money spent in that category in that province.
- Expenditures as a percentage of total means percentage of R&D expenditures in that province compared to total R&D in Canada.
- Rows and columns may not equal totals due to rounding.
- Current expenditures plus capital expenditures (equipment + depreciation) = total R&D expenditures.
Source: PMPRB