Biosimilars in Canada:
Current Environment and Future Opportunity
April 2019
PDF - 647 KB
Biologics – an important segment
of the Canadian pharmaceutical market
Biologics* share of the pharmaceutical sales, OECD, 2018
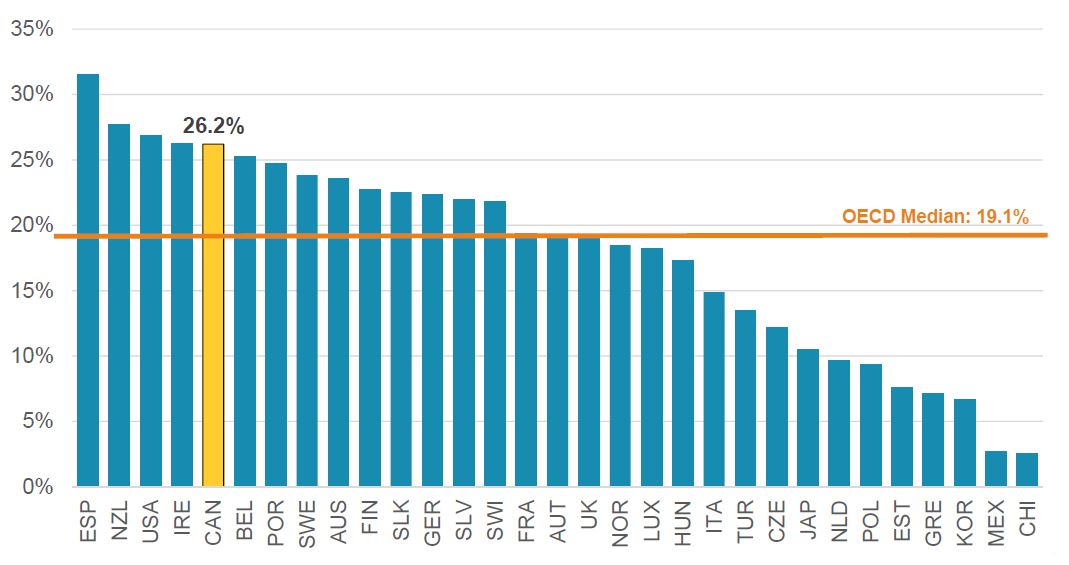
Figure description
This bar graph gives the market share for biologic medicines among all pharmaceutical sales for each of the countries in the Organisation for Economic Co-operation and Development in 2018. The median for all listed countries was 19.1%.
| Country |
Share |
| Spain |
31.6% |
| New Zealand |
27.7% |
| United States |
26.8% |
| Ireland |
26.3% |
| Canada |
26.2% |
| Belgium |
25.3% |
| Portugal |
24.7% |
| Sweden |
23.8% |
| Australia |
23.6% |
| Finland |
22.7% |
| Slovakia |
22.5% |
| Germany |
22.3% |
| Slovenia |
22.0% |
| Switzerland |
21.8% |
| France |
19.4% |
| Austria |
19.1% |
| United Kingdom |
19.1% |
| Norway |
18.5% |
| Luxemburg |
18.2% |
| Hungary |
17.3% |
| Italy |
14.9% |
| Turkey |
13.5% |
| Czech Republic |
12.2% |
| Japan |
10.5% |
| Netherlands |
9.7% |
| Poland |
9.3% |
| Estonia |
7.6% |
| Greece |
7.1% |
| South Korea |
6.7% |
| Mexico |
2.7% |
| Chile |
2.6% |
Data source: MIDAS™ Database, prescription retail and hospital markets, 2018, IQVIA. All rights reserved.
*Includes biologics patented in Canada as of 2017.
Canada has the second highest per capita spending on biologics
Spending per capita, patented biologics*, OECD, 2018
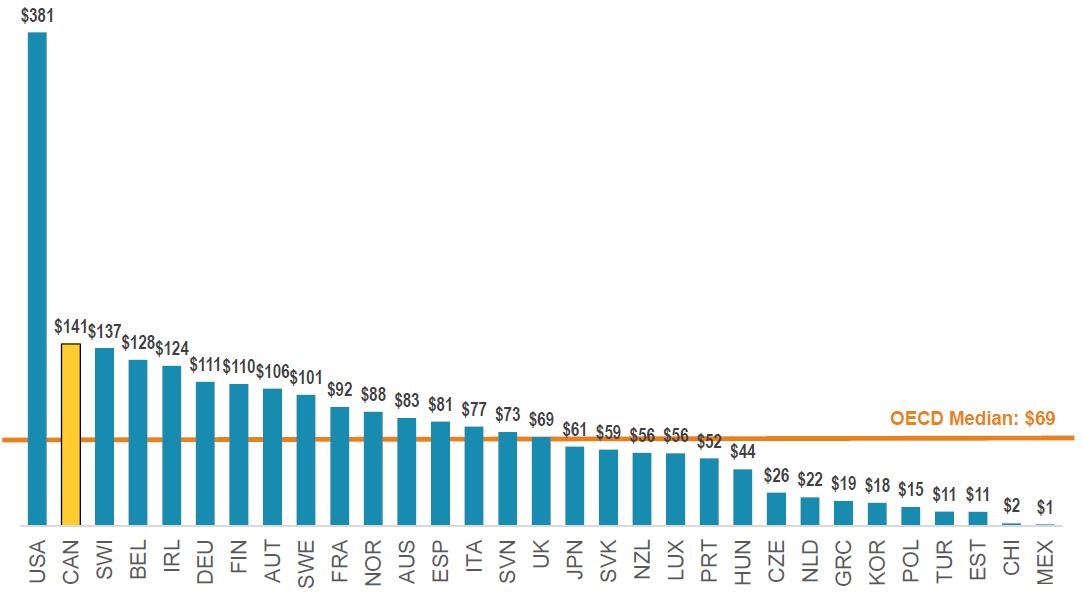
Figure description
This bar graph gives the spending per capita on patented biologic medicines, in dollars, for each country in the Organisation for Economic Co-operation and Development in 2017. The median for all listed countries was $69.
| Country |
Spending per capita |
| United States |
$381 |
| Canada |
$141 |
| Switzerland |
$137 |
| Belgium |
$128 |
| Ireland |
$124 |
| Germany |
$111 |
| Finland |
$110 |
| Austria |
$106 |
| Sweden |
$101 |
| France |
$92 |
| Norway |
$88 |
| Australia |
$83 |
| Spain |
$81 |
| Italy |
$77 |
| Slovenia |
$73 |
| United Kingdom |
$69 |
| Japan |
$61 |
| Slovakia |
$59 |
| New Zealand |
$56 |
| Luxemburg |
$56 |
| Portugal |
$52 |
| Hungary |
$44 |
| Czech Republic |
$26 |
| Netherlands |
$22 |
| Greece |
$19 |
| South Korea |
$18 |
| Poland |
$15 |
| Turkey |
$11 |
| Estonia |
$11 |
| Chile |
$2 |
| Mexico |
$1 |
Data source: MIDAS™ Database, prescription retail and hospital markets, 2018, IQVIA. All rights reserved.
*Includes biologics patented in Canada as of 2017.
Canada has the second highest prices for biologics
Average foreign-to-Canadian price ratios, patented biologics*, OECD, 2018
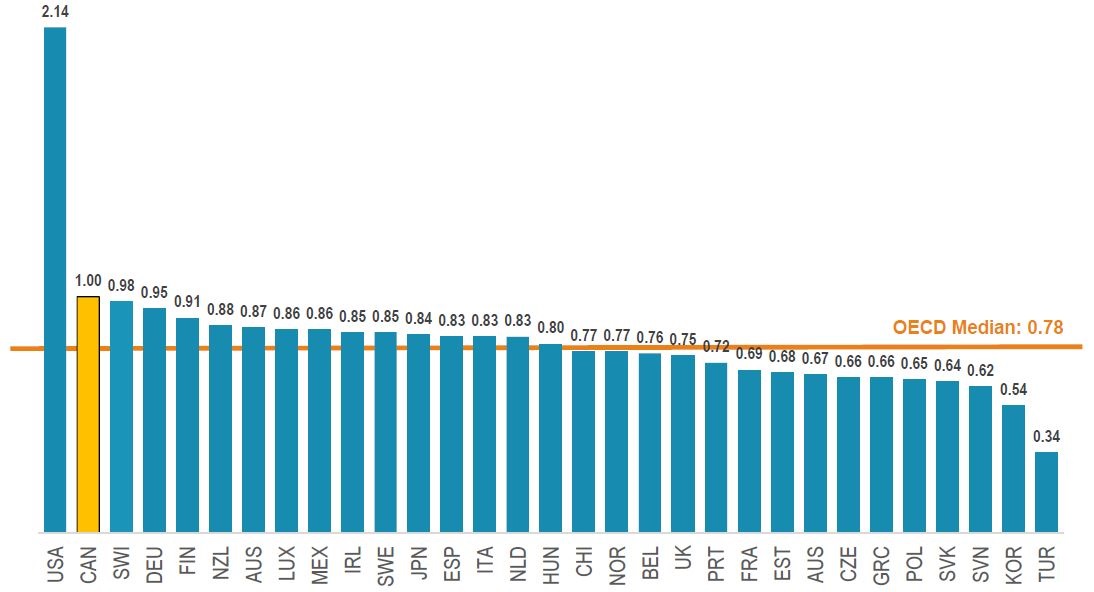
Figure description
This bar graph gives the average foreign-to-Canadian price ratios for all patented biologic medicines in 2018 for each country in the Organisation for Economic Co-operation and Development. This group of biologics include those patented in Canada as of 2017. The median for all listed countries was 0.78.
| Country |
Share |
| United States |
2.14 |
| Canada |
1 |
| Switzerland |
0.98 |
| Germany |
0.95 |
| Finland |
0.91 |
| New Zealand |
0.88 |
| Austria |
0.87 |
| Luxemburg |
0.86 |
| Mexico |
0.86 |
| Ireland |
0.85 |
| Sweden |
0.85 |
| Japan |
0.84 |
| Spain |
0.83 |
| Italy |
0.83 |
| Netherlands |
0.83 |
| Hungary |
0.8 |
| Chile |
0.77 |
| Norway |
0.77 |
| Belgium |
0.76 |
| United Kingdom |
0.75 |
| Portugal |
0.72 |
| France |
0.69 |
| Estonia |
0.68 |
| Australia |
0.67 |
| Czech Republic |
0.66 |
| Greece |
0.66 |
| Poland |
0.65 |
| Slovakia |
0.64 |
| Slovenia |
0.62 |
| South Korea |
0.54 |
| Turkey |
0.34 |
Data source: MIDAS™ Database, prescription retail and hospital markets, 2018, IQVIA. All rights reserved.
*Includes biologics patented in Canada as of 2017.
Biologics sales are on the rise, despite biosimilar availability in high-sales areas
Trends in patented biologics* sales, Canada, 2009-2018
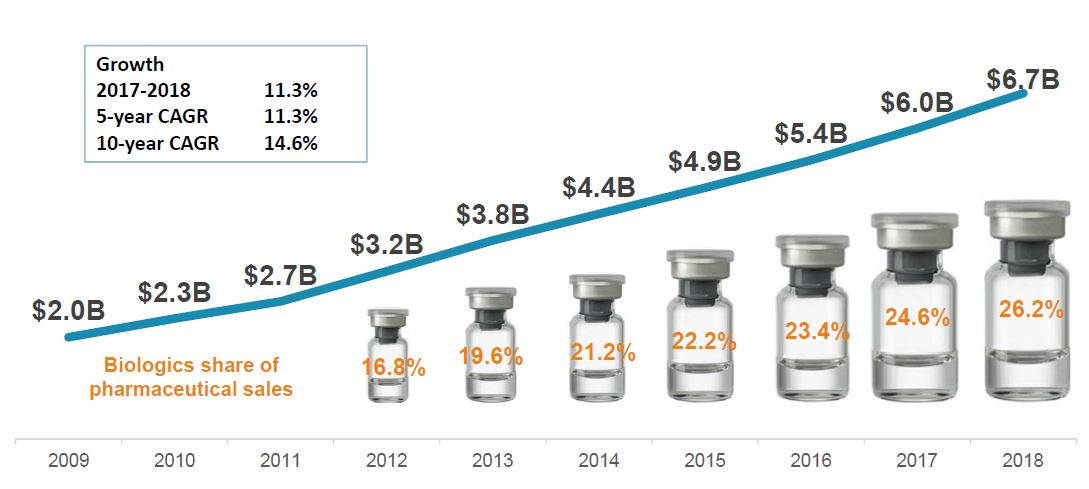
Figure description
A line graph depicts the Canadian sales in billions of dollars for biologics patented in Canada as of 2017, for each year from 2009 to 2018. Below, a graphic reports the share of biologic sales as a percentage of the total prescription pharmaceutical market, for each year from 2012 to 2018. The growth rate from 2017 to 2018 (11.3%) as well as the 5-year (11.3%) and 10-year (14.6%) compound annual growth rates are also given.
| |
2009 |
2010 |
2011 |
2012 |
2013 |
2014 |
2015 |
2016 |
2017 |
2018 |
| Canadian sales in billions of dollars |
$2.0 |
$2.3 |
$2.7 |
$3.2 |
$3.8 |
$4.4 |
$4.9 |
$5.4 |
$6.0 |
$6.7 |
| Biologics share of pharmaceutical sales |
- |
- |
- |
16.8% |
19.6% |
21.2% |
22.2% |
23.4% |
24.6% |
26.2% |
Data source: MIDAS™ Database, prescription retail and hospital markets, 2018, IQVIA. All rights reserved.
*Includes biologics patented in Canada as of 2017.
Biosimilar availability: Canada lags behind Europe
Cumulative number of biosimilar medicines approved from 2006 to 2017
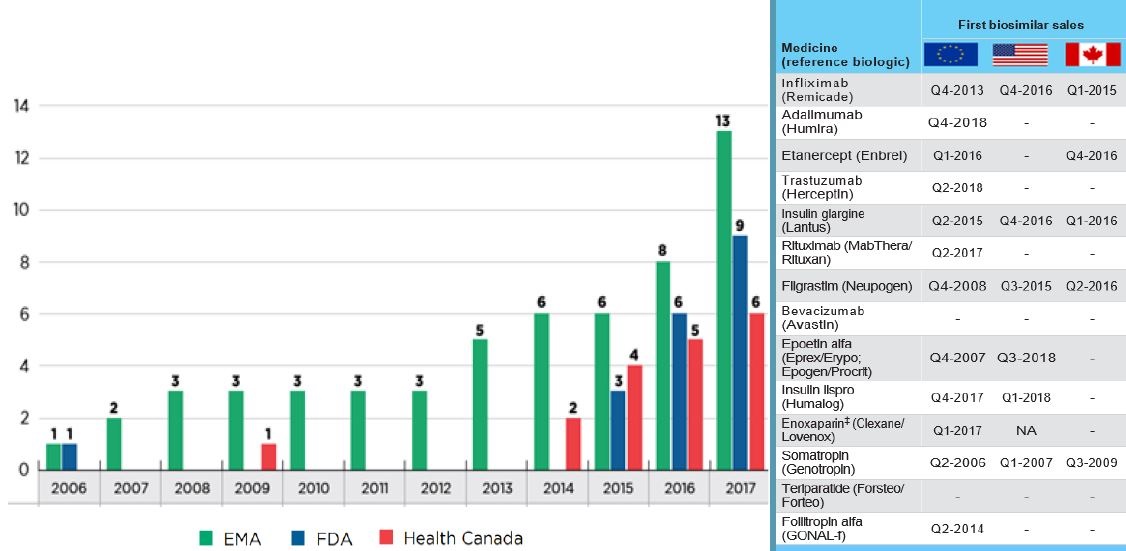
Figure description
This figure consists of a bar graph and accompanying table. The bar graph gives the cumulative number of biosimilar medicines approved from 2006 to 2017 by each of three regulatory agencies: the Food and Drug Administration (FDA) in the United States, the European Medicines Agency (EMA), and Health Canada.
|
2006 |
2007 |
2008 |
2009 |
2010 |
2011 |
2012 |
2013 |
2014 |
2015 |
2016 |
2017 |
| European Medicines Agency |
1 |
2 |
3 |
3 |
3 |
3 |
3 |
5 |
6 |
6 |
8 |
13 |
| US Food and Drug Administration |
1 |
- |
- |
- |
- |
- |
- |
- |
- |
3 |
6 |
9 |
| Health Canada |
- |
- |
- |
1 |
- |
- |
- |
- |
2 |
4 |
5 |
6 |
| Cumulative number of biosimilars approved |
1 |
2 |
3 |
3 |
3 |
3 |
3 |
5 |
6 |
6 |
8 |
14 |
The table on the right provides the date of first biosimilar sale for each of the 14 medicines in Canada, the United States, and Europe.
| Medicine (reference biologic) |
First biosimilar sales |
| EU |
US |
Canada |
| Infliximab (Remicade) |
Q4-2013 |
Q4-2016 |
Q1-2015 |
| Adalimumab (Humira) |
Q4-2018 |
- |
- |
| Etanercept (Enbrel) |
Q1-2016 |
- |
Q4-2016 |
| Trastuzumab (Herceptin) |
Q2-2018 |
- |
- |
| Insulin glargine (Lantus) |
Q2-2015 |
Q4-2016 |
Q1-2016 |
| Rituximab (MabThera/Rituxan) |
Q2-2017 |
- |
- |
| Filgrastim (Neupogen) |
Q4-2008 |
Q3-2015 |
Q2-2016 |
| Bevacizumab (Avastin) |
- |
- |
- |
| Epoetin alfa (Eprex/Erypo; Epogen/Procrit) |
Q4-2007 |
Q3-2018 |
- |
| Insulin lispro (Humalog) |
Q4-2017 |
Q1-2018 |
- |
| Enoxaparin‡ (Clexane/Lovenox) |
Q1-2017 |
NA |
- |
| Somatropin (Genotropin) |
Q2-2006 |
Q1-2007 |
Q3-2009 |
| Teriparatide (Forsteo/Forteo) |
- |
- |
- |
| Follitropin alfa (GONAL-f) |
Q2-2014 |
- |
- |
Data source: MIDAS™ Database, prescription retail and hospital markets, 2017-2018, IQVIA. All rights reserved.
*Includes biologics patented in Canada as of 2017.
Biosimilar uptake: Canada lags behind Europe
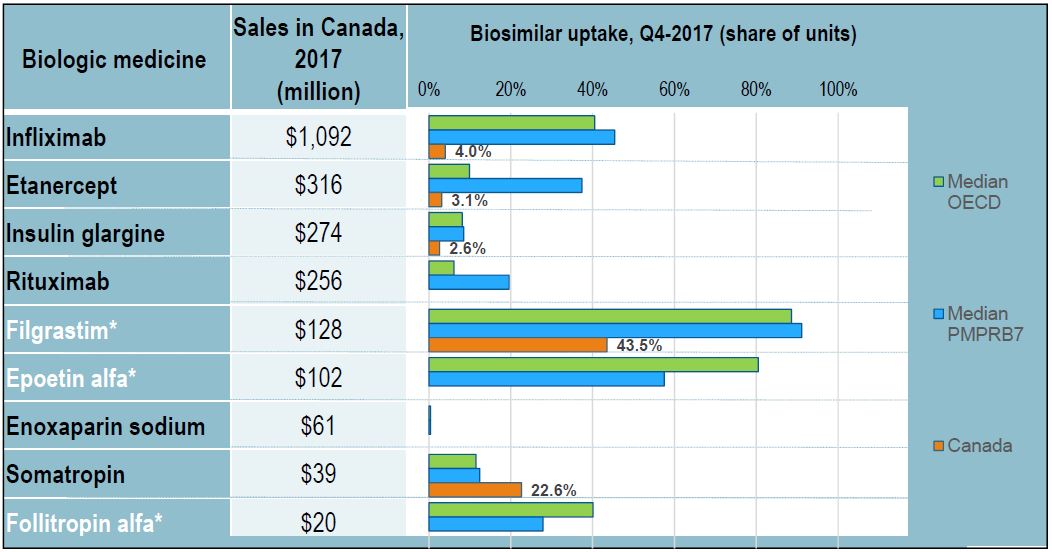
Figure description
This table and bar graph report on the biologic medicines with biosimilar uptake in Canada, the PMPRB7, or the Organisation for Economic Co-operation and Development as of the fourth quarter of 2017. For each biologic medicine, the table give the Canadian sales for 2017 and the bar graph illustrates the biosimilar share of units in the fourth quarter of 2017 for Canada, the Organisation for Economic Co-operation and Development median, and the median of the seven PMPRB comparator countries.
| Biologic medicine |
Sales in Canada, 2017 (million) |
Biosimilar uptake, Q4-2017 (share of units) |
| Median OECD |
Median PMPRB7 |
Canada |
| Infliximab |
$1,092 |
40.5% |
45.4% |
4.0% |
| Etancercept |
$316 |
9.9% |
37.4% |
3.1% |
| Insulin glargine |
$274 |
8.1% |
8.5% |
2.6% |
| Rituximab |
$256 |
6.1% |
19.6% |
- |
| Filgrastim* |
$128 |
88.6% |
91.1% |
43.5% |
| Epoetin alfa* |
$102 |
80.5% |
57.5% |
- |
| Enoxaparin sodium |
$61 |
0.4% |
0.4% |
- |
| Somatropin |
$39 |
11.5% |
12.4% |
22.6% |
| Follitropin alfa* |
$20 |
40.1% |
27.9% |
- |
*Acute biologics
Data source: MIDAS™ Database, prescription retail and hospital markets, 2017, IQVIA. All rights reserved
Barriers to biosimilar uptake in Canada
- As in most countries (except for Poland), biosimilars are not interchangeable with the reference biologic
- Unlike in many OECD countries, the switching from an ongoing biological treatment to an approved
biosimilar has not been pursued, or encouraged in Canada (except for Quebec, Green Shield).
- Patients and manufacturers of originator biologic vocal opponents of the biosimilar switching (public position
statements)
- Strategies/initiatives undertaken by the manufacturer of the reference biologic that may limit the uptake
of biosimilars:
- Free reference biologics reportedly offered to hospitals, where treatment is often initiated
- Exclusivity agreements with third-party infusion clinic networks
- Fees to specialists for administering the product
- Agreements with payers that favour the originator over the biosimilars
- Patient Support Programs: offer services like access to clinics and reimbursement navigation.
- Most Canadian public payers have implemented policies of reimbursing the biosimilar for naïve patients
– with limited success, as nothing prevents the physician from prescribing a different brand
Fewer patients initiated on infliximab after biosimilar entry
…instead, new patients start on other originator products
Less than half of new infliximab patients were initiated on the biosimilar in 2017
Number of new patients on select DMARDs & Distribution of new patients by select DMARDs
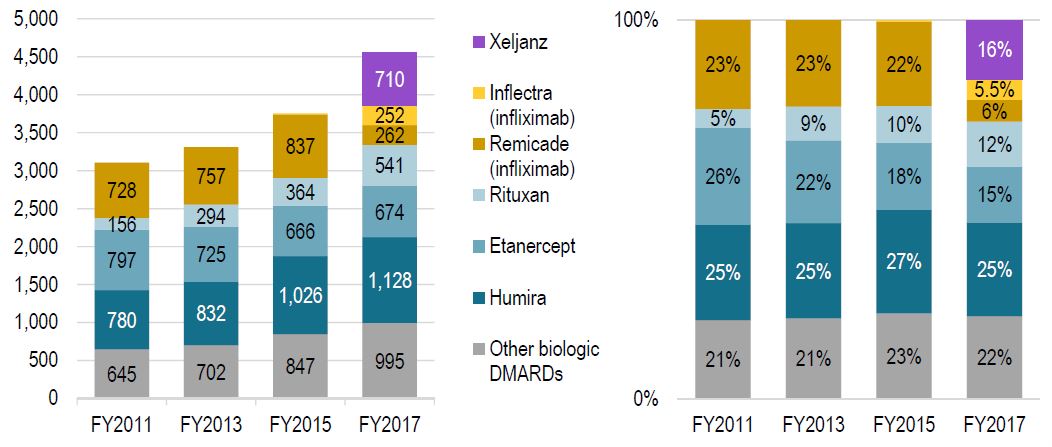
Figure description
These two column graphs illustrate the distribution of patients initiated on non-conventional disease-modifying antirheumatic drugs (DMARDs) in Canadian public plans in fiscal years 2011, 2013, 2015, and 2017. The selected drugs included in the analysis are Xeljanz, Inflectra (infliximab), Remicade (infliximab), Rituxan, Etanercept, and Humira. A value is also included for all other biologic disease-modifying antirheumatic drugs. The first graph gives the number of new patients started on each of the selected drugs. The second graph gives the corresponding share of each drug as a percentage of all new patients.
|
2011 |
2013 |
2015 |
2017 |
| |
Number of new patients |
Share of new patients |
Number of new patients |
Share of new patients |
Number of new patients |
Share of new patients |
Number of new patients |
Share of new patients |
| Xeljanz |
0 |
– |
0 |
– |
0 |
– |
710 |
16% |
| Inflectra (infliximab) |
0 |
– |
0 |
– |
14 |
0% |
252 |
5.5% |
| Remicade (infliximab) |
728 |
23% |
757 |
23% |
837 |
22% |
262 |
6% |
| Rituxan |
156 |
5% |
294 |
9% |
364 |
10% |
541 |
12% |
| Etancercept |
797 |
26% |
725 |
22% |
666 |
18% |
674 |
15% |
| Humira |
780 |
25% |
832 |
25% |
1026 |
27% |
1128 |
25% |
| Other biologic biologic disease-modifying antirheumatic drugs |
645 |
21% |
702 |
21% |
847 |
23% |
995 |
22% |
Data source: National Prescription Drug Utilization Information System Database,
Canadian Institute for Health Information.
The infliximab experience: the biosimilar uptake
Without switching existing patients and only initiating few new patients on the biosimilars, Canada lags behind all OECD countries in terms of the infliximab biosimilar uptake
Meds Entry Watch 2017
Biosimilar uptake (share of units), infliximab, Q4-2018
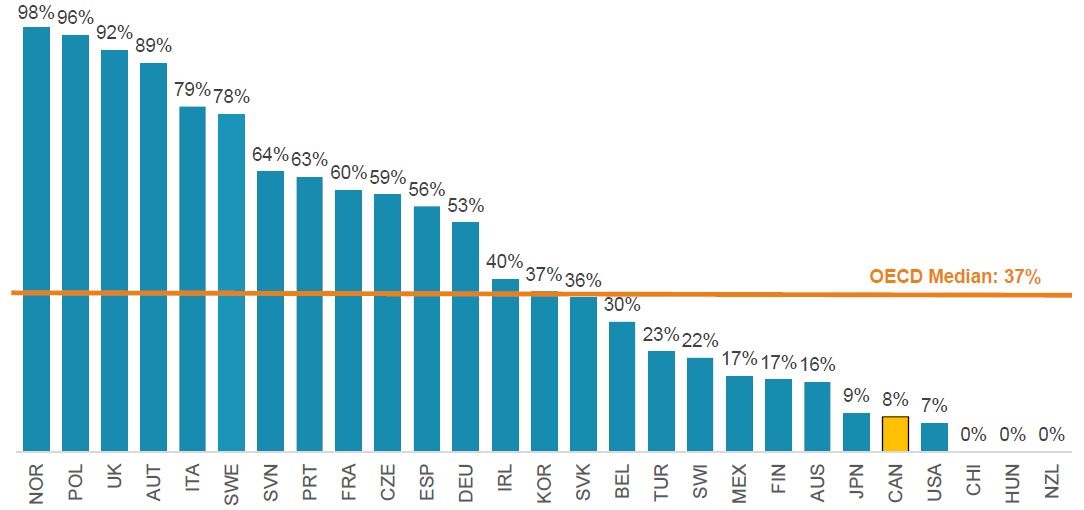
Figure description
This bar graph gives the biosimilar uptake of infliximab for each country in the Organisation for Economic Co-operation and Development, as a percent share of all infliximab units in the fourth quarter of 2018. The median for all countries listed was 37%.
| Country |
Share of units |
| Norway |
98% |
| Poland |
96% |
| United Kingdom |
92% |
| Austria |
89% |
| Italy |
79% |
| Sweden |
78% |
| Slovenia |
64% |
| Portugal |
63% |
| France |
60% |
| Czech Republic |
59% |
| Spain |
56% |
| Germany |
53% |
| Ireland |
40% |
| Korea |
37% |
| Slovakia |
36% |
| Belgium |
30% |
| Turkey |
23% |
| Switzerland |
22% |
| Mexico |
17% |
| Finland |
17% |
| Austria |
16% |
| Japan |
9% |
| Canada |
8% |
| United States |
7% |
| Chile |
0% |
| Hungary |
0% |
| New Zealand |
0% |
Data source: MIDAS™ Database, prescription retail and hospital markets, Q4-2018, IQVIA. All rights reserved.
Biosimilars are often priced higher in Canada
Biosimilar prices are generally
higher, despite
greater
discounts,
likely due to
higher
originator
prices
prevailing in Canada
| Biosimilar (highest-selling form and strength) |
Price in Canada ($) |
Foreign-to-Canadian price ratios |
Median foreign prices (CAD) |
Discount relative to reference biologic, Q4-2017 |
| PMPRB7 |
OECD |
PMPRB7 |
OECD |
Canada |
Infliximab
(inf. dry bottle, 100 mg) |
535 |
1.08 |
0.93 |
578 |
495 |
45.0% |
Etanercept
(prefill autoinj, 50 mg/mL, 0.98 mL) |
274 |
0.84 |
0.87 |
231 |
237 |
30.6% |
Insulin glargine
(prefill pens, 100 IU/mL, 3 mL) |
14.30 |
0.85 |
0.77 |
12.08 |
11.00 |
23.9% |
Rituximab
(infus.via/bot., 10 mg/mL, 50 mL) |
- |
- |
- |
1,638 |
1,524 |
- |
Filgrastim
(prefill syrng, 600 y/mL, 0.5 mL) |
144 |
0.61 |
0.41 |
88.09 |
59.52 |
17.6% |
Epoetin alfa
(prefill syrng, 40 K/mL, 1 mL) |
- |
- |
- |
329 |
314 |
- |
Enoxaparin
(prefill syrng sc, 10 K/mL, 0.4 mL) |
- |
- |
- |
3.62 |
3.62 |
- |
Somatropin
(cartridges, 20 IU/mL, 1.5 mL) |
308 |
1.08 |
0.88 |
333 |
272 |
18.2% |
Follitropin alfa
(prefill pens, 600 IU/mL, 1.5 mL) |
- |
- |
- |
- |
- |
- |
| Sales-weighted average |
- |
0.97 |
0.85 |
- |
- |
36.7% |
Data source: MIDAS™ Database, prescription retail and hospital markets, 2017, IQVIA. All rights reserved.
Why biosimilar savings matter?
Cost drivers in select Canadian public drug plans
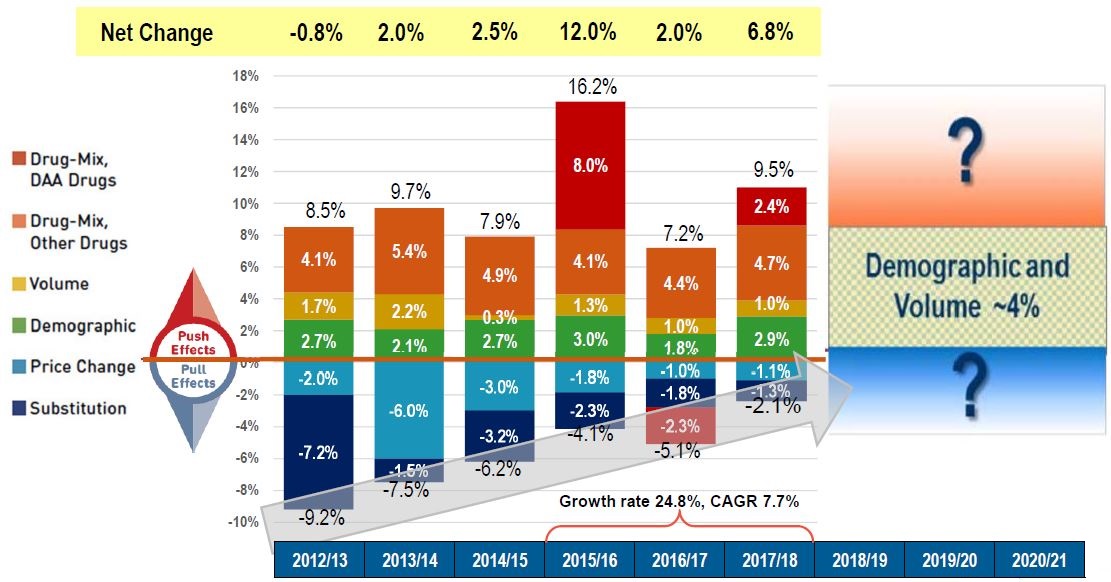
Figure description
This column graph describes the key factors or effects that impacted the rates of change in drug costs across all NPDUIS public drug plans for each year from 2012/13 to 2017/18. Each column is broken out to give the positive or negative contribution of each effect: drug-mix for direct-acting antiviral (DAA) drugs for the treatment of hepatitis C; drug-mix for all other drugs; volume; demographic; price change; and substitution. The total positive push effect, negative pull effect, and net change for each year are also shown. From 2015/16 to 2017/18, the growth rate was 24.8% and the compound annual growth rate was 7.7%. A graphic for the period from 2018/19 to 2020/2021 estimates the demographic and volume effect at around 4%, indicating that the future negative or positive growth will be dependent on the other opposing factors.
| 2012/13 |
2012/13 |
2013/14 |
2014/15 |
2015/16 |
2016/17 |
2017/18 |
| Drug-mix, direct-acting antiviral (DAA) drugs |
– |
– |
– |
8.0% |
-2.3% |
2.4% |
| Drug mix, other drugs |
4.1% |
5.4% |
4.9% |
4.1% |
4.4% |
4.7% |
| Volume |
1.7% |
2.2% |
0.3% |
1.3% |
1.0% |
1.0% |
| Demographic |
2.7% |
2.1% |
2.7% |
3.0% |
1.8% |
2.9% |
| Price change |
-2.0% |
-6.0% |
-3.0% |
-1.8% |
-1.0% |
-1.1% |
| Substitution |
-7.2% |
-1.5% |
-3.2% |
-2.3% |
-1.8% |
-1.3% |
| Total push effect |
8.5% |
9.7% |
7.9% |
16.2% |
7.2% |
9.5% |
| Total pull effect |
-9.2% |
-7.5% |
-6.2% |
-4.1% |
-5.1% |
-2.1% |
| Net change |
-0.8% |
2.0% |
2.5% |
12.0% |
2.0% |
6.8% |
Note: Drug costs include markups.
Data source: National Prescription Drug Utilization Information System Database, Canadian Institute for Health Information.
Canadian savings only a fraction of their potential
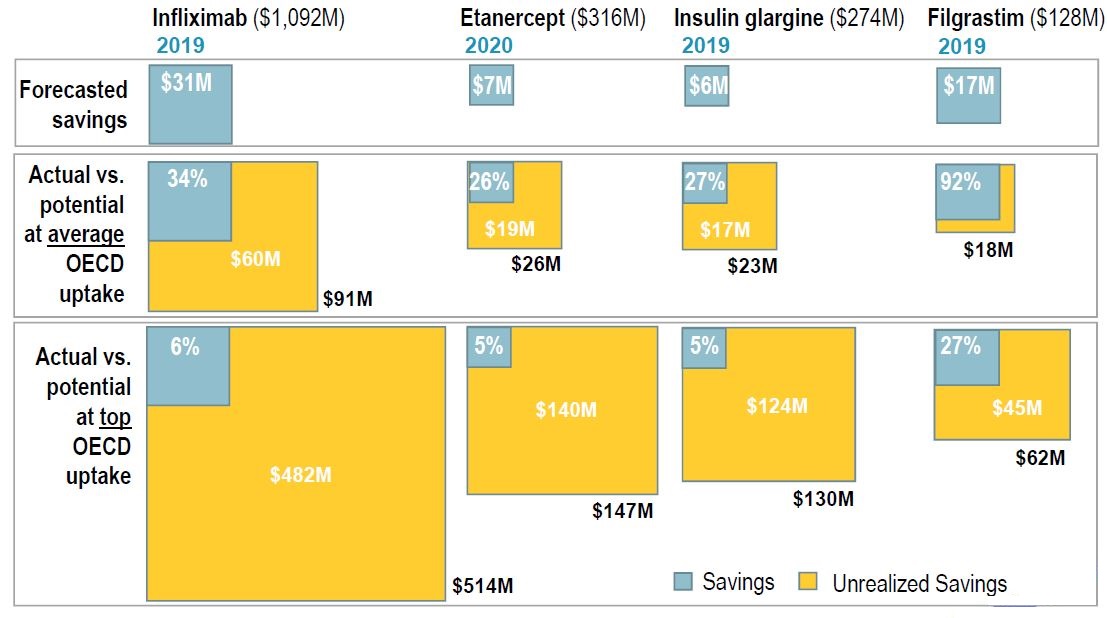
Figure description
This graphic describes the actual and unrealized saving of biosimilar substitution for four biologic medicines (infliximab, etanercept, insulin glargine, and filgrastim) as proportional squares. Actual savings are shown as a portion of the total potential savings and given as a percentage, while the difference between the two is given as a dollar amount, in millions. Potential savings are measured at the level of the average Organisation Economic Co-operation and Development uptake as well as at the top uptake. The total market for each medicine is also given in millions of dollars.
| |
Infliximab |
Etanercept |
Insulin glargine |
Filgrastim |
| Total sales, in millions of dollars |
$1,092 |
$316 |
$6 |
$128 |
| Year |
2019 |
2020 |
2019 |
2019 |
| |
Savings |
Unrealized savings |
Total potential savings |
Savings |
Unrealized savings |
Total potential savings |
Savings |
Unrealized savings |
Total potential savings |
Savings |
Unrealized savings |
Total potential savings |
| Forecasted savings, in millions of dollars |
$31 |
– |
– |
$7 |
– |
– |
$6 |
– |
– |
$17 |
– |
– |
| Actual versus potential at average Organisation Economic Co-operation and Development uptake |
34% |
$60 million |
$91 million |
26% |
$19 million |
$26 million |
27% |
$17 million |
$23 million |
92% |
– |
$18 million |
| Actual versus potential at top Organisation Economic Co-operation and Development uptake |
6% |
$482 million |
$514 million |
5% |
$140 million |
$147 million |
5% |
$124 million |
$130 million |
27% |
$45 million |
$62 million |
Data source: MIDAS™ Database, prescription retail and hospital markets, IQVIA. All rights reserved.
Recent developments in Canada
- Biosimilar industry association: announces the introduction of Patient Support Programs to be launched in 2019
- HTA: CADTH streamlined the biosimilar review process (Feb 2018), with fewer submission requirements, shortened review period, etc.
- Price negotiation: pCPA Policy on Biologics and Biosimilars (Sept 2018) aims for parallel processes with the HTA, requires price transparency and considers the implementation of tiered listing and switching
- Public payers:
- Preferential reimbursement: generally applies to biosimilars for treatment-naïve patients (e.g., Remicade) – those on reference biologic do not have to switch; Quebec only reimburses the lowest priced version of infliximab
- Tiered reimbursement: implemented by Manitoba – new patients required to try two Tier 1 products before being reimbursed for a Tier 2 product; Tier 1 biologic products have been determined to be the most costeffective
- Private payers:
- Preferential reimbursement: e.g., Green Shield Canada opened its biosimilar transition program to any sponsor who wishes to take part (Dec 2018); patients that do not switch to the biosimilar pay the difference out of pocket
Conclusions
- Canada has the second highest spending on biologics in the OECD, and pays the second highest prices
- Canadian biosimilar availability and uptake lags behind Europe
- Biosimilar savings have been minimal in Canada, well below international norms
- Given the cost pressures, payers depend on biosimilar savings to fund new and
innovative therapies
- Canadian biosimilar industry, HTA, price negotiators, and payers are taking steps towards
greater market penetration of biosimilars: Patient Support Programs, streamlined and
transparent processes, preferential reimbursement, transitioning, and tiered
reimbursement